
Memory profiling in Unity
Profiling and honing your game’s performance for a broad range of platforms and devices, you can expand your player base and increase your chance for success.
This page provides information on two tools for analyzing memory usage in your application in Unity: the built-in Memory Profiler module, and the Memory Profiler package, a Unity package that you can add to your project.
The information here is excerpted from the e-book, Ultimate guide to profiling Unity games, available to download for free. The e-book was created by both external and internal Unity experts in game development, profiling, and optimization.
Read on to learn about memory profiling in Unity.
Memory profiling
Memory profiling is useful for testing against hardware platform memory limitations, decreasing loading time and crashes, and making your project compatible with older devices. It can also be relevant if you want to improve CPU/GPU performance by making changes that actually increase memory usage. It is largely unrelated to runtime performance.
There are two ways of analyzing memory usage in your application in Unity.
The Memory Profiler module: This is a built-in profiler module that gives you basic information on where your application uses memory.
The Memory Profiler package: This is a Unity package that you can add to your project. It adds an additional Memory Profiler window to the Unity Editor, which you can then use to analyze memory usage in your application in even more detail. You can store and compare snapshots to find memory leaks, or see the memory layout to find memory fragmentation issues.
With these built-in tools, you can monitor memory usage, locate areas of an application where memory usage is higher than expected, and find and improve memory fragmentation.
Understand and define a memory budget
Understanding and budgeting for the memory limitations of your target devices are critical for multiplatform development. When designing scenes and levels, stick to the memory budget that’s set for each target device. By setting limits and guidelines, you can ensure that your application works well within the confines of each platform’s hardware specification.
You can find device memory specifications in developer documentation. For example, the Xbox One console is limited to 5 GB of maximum available memory for games running in the foreground, according to documentation.
It can also be useful to set content budgets around mesh and shader complexity, as well as for texture compression. These all play into how much memory is allocated. These budget figures can be referred to during the project’s development cycle.
Determine physical RAM limits
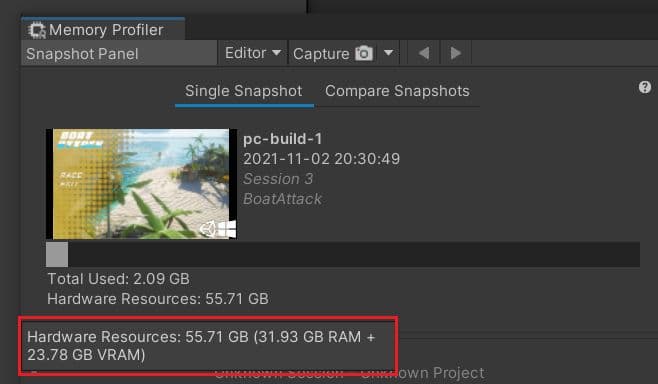
Each target platform has a memory limit, and once you know it, you can set a memory budget for your application. Use the Memory Profiler to look at a capture snapshot. The Hardware Resources (see image above) shows Physical Random Access Memory (RAM) and Video Random Access Memory (VRAM) sizes. This figure doesn’t account for the fact that not all of that space might be available to use. However, it provides a useful ballpark figure to start working with.
It’s a good idea to cross reference hardware specifications for target platforms, as figures displayed here might not always show the full picture. Developer kit hardware sometimes has more memory, or you may be working with hardware that has a unified memory architecture.
Determine the lowest RAM specification
Identify the hardware with the lowest specification in terms of RAM for each platform you support, and use this to guide your memory budget decision. Remember that not all of that physical memory might be available to use. For example, a console could have a hypervisor running to support older games which might use some of the total memory. Think about a percentage (e.g., 80% of total) to use. For mobile platforms, you might also consider splitting into multiple tiers of specifications to support better quality and features for those with higher-end devices.
Consider per-team budgets for larger teams
Once you have a memory budget defined, consider setting memory budgets per team. For example, your environment artists get a certain amount of memory to use for each level or scene that is loaded, the audio team gets memory allocation for music and sound effects, and so on.
It’s important to be flexible with the budgets as the project progresses. If one team comes in way under budget, assign the surplus to another team if it can improve the areas of the game they’re developing.
Once you decide on and set memory budgets for your target platforms, the next step is to use profiling tools to help you monitor and track memory usage in your game.
Two views with Memory Profiler module
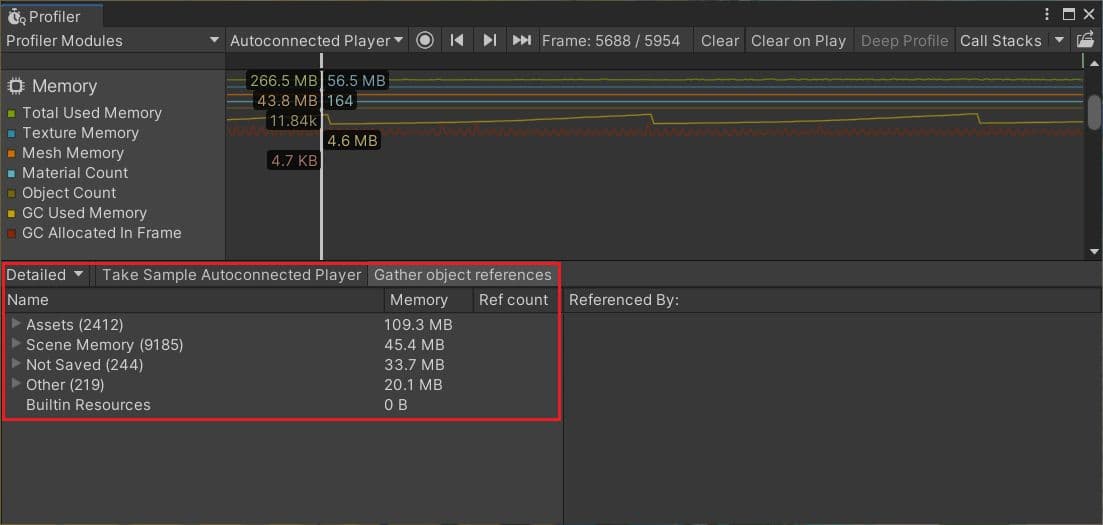
The Memory Profiler module provides two views: Simpleand Detailed. Use the Simple view to get a high-level view of memory usage for your application. When necessary, switch to the Detailed view to drill down further.
Simple
The Total Reserved Memory figure is the “Total Tracked by Unity Memory.” It includes memory that Unity has reserved but isn't using right now (that figure is the Total Used Memory).
The System Used Memory figure is what the OS considers as being in use by your application. If this figure ever displays 0, be aware this indicates the Profiler counter is not implemented on the platform you are profiling. In this case, the best indicator to rely on is Total Reserved Memory. It’s also recommended to switch to a native platform profiling tool for detailed memory information in these cases.
Detailed view in Memory Profiler
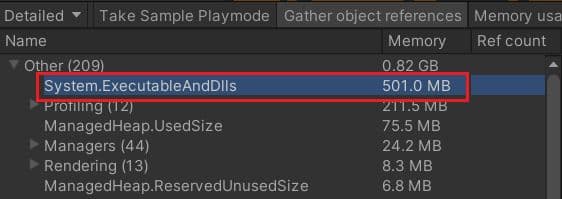
To look into how much memory is used by your executable, DLLs, and the Mono Virtual Machine, frame-by-frame memory figures will not cut it. Use a Detailed snapshot capture to dig into this kind of a memory breakdown.
Note: The reference tree in the Detailed view of the Memory Profiler module only shows Native references. References from objects of types inheriting from UnityEngine.Object might show up with the name of their managed shells. However, they might show up only because they have Native Objects underneath them. You won’t necessarily see any managed type. Let’s take as an example an object with a Texture2Din one of its fields as a reference. Using this view, you won’t see which field holds that reference, either. For this kind of detail, use the Memory Profiler Package.
To determine at a high-level when memory usage begins to approach platform budgets, use the following “back of the napkin” calculation:
System Used Memory (or Total Reserved Memory if System Used shows 0) + ballpark buffer of untracked memory / Platform total memory
When this figure starts approaching 100% of your platform’s memory budget, use the Memory Profiler package to figure out why.
Many of the features of the Memory Profiler module have been superseded by the Memory Profiler package, but you can still use the module to supplement your memory analysis efforts.
For example:
- To spot GC allocations: Although these show up in the module, they are easier to track down using Project Auditor or Deep Profiling.
- To quickly look at the Used/Reserved size of the heap
- Shader memory analysis
Remember to profile on the device that has the lowest specs for your overall target platform when setting a memory budget. Closely monitor memory usage, keeping your target limits in mind.
You’ll usually want to profile using a powerful developer system with lots of memory available (space for storing large memory snapshots or loading and saving those snapshots quickly is important).
Memory profiling is a different beast compared with CPU and GPU profiling in that it can incur additional memory overhead itself. You may need to profile memory on higher-end devices (with more memory), but specifically watch out for the memory budget limit for the lower-end target specification.
Points to consider when profiling for memory usage:
- Settings such as quality levels, graphics tiers, and AssetBundle variants may have different memory usage on more powerful devices. For example:
- The Quality Level and Graphics settings could affect the size of RenderTextures used for shadow maps.
- Resolution scaling could affect the size of the screen buffers, RenderTextures, and post-processing effects.
- Texture quality setting could affect the size of all Textures.
- The maximum LOD could affect Models and more.
- If you have AssetBundle variants like an HD (High Definition) and an SD (Standard Definition) version and choose which one to use based on the device specifications, you also might get different asset sizes based on which device you are profiling on.
- The Screen Resolution of your target device will affect the size of RenderTextures used for post-processing effects.
- The supported Graphics API of a device might affect the size of shaders based on which variants of them are supported or not by the API.
- Having a tiered system that uses different Quality Settings, Graphic Tier settings, and Asset Bundle variations is a great way to be able to target a wider range of devices, e.g., by loading a High Definition version of an AssetBundle on a 4 GB mobile device, and a Standard Definition version on a 2 GB device. However, take the above variations in memory usage in mind and make sure to test both types of devices, as well as devices with different screen resolutions or supported graphics APIs.
Note: The Unity Editor will generally always show a larger memory footprint due to additional objects that are loaded from the Editor and Profiler. It may even show Asset Memory that would not be loaded into memory in a build, such as from Asset Bundles (depending on the Addressables simulation mode) or Sprites and Atlases, or for Assets shown in the Inspector. Some of the reference chains may also be more confusing in the Editor.
The Memory Profiler package
The Memory Profiler is currently in preview for Unity 2019 LTS or newer but is expected to be verified in Unity 2022 LTS.
One great benefit of the Memory Profiler package is that, as well as capturing native objects (like the Memory Profiler module does), it also allows you to view Managed Memory, save and compare snapshots, and explore the memory contents in even more detail, with visual breakdowns of your memory usage.
A snapshot shows memory allocations in the engine, allowing you to quickly identify the causes of excessive or unnecessary memory usage, track down memory leaks, or see heap fragmentation.
After installing the Memory Profiler package, open it by clicking Window > Analysis > Memory Profiler.
The Memory Profiler’s top menu bar allows you to change the player selection target and capture or import snapshots.
Note: Profile memory on target hardware by connecting the Memory Profiler to the remote device with the Target selection dropdown. Profiling in the Unity Editor will give you inaccurate figures due to overheads added by the Editor and other tooling.
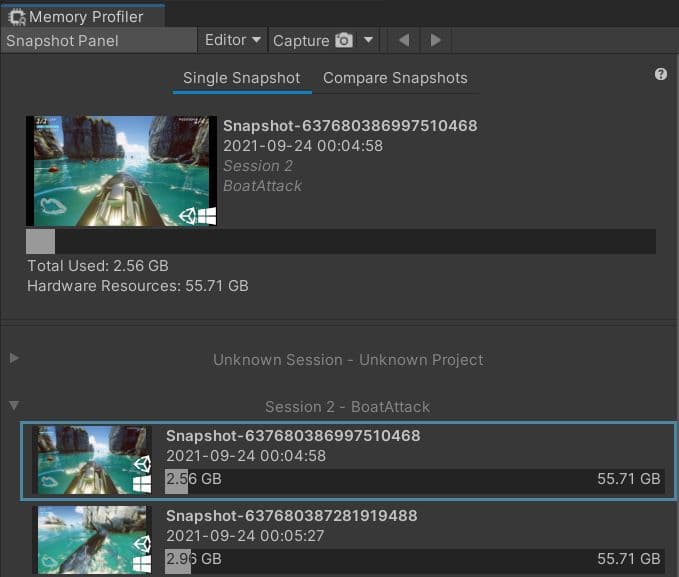
Single and Compare Snapshots views
On the left of the Memory Profiler window is the Workbencharea. Use this to manage and open or close saved memory snapshots. You can also use this area to switch between Single and Compare Snapshots views.
Similar to Profile Analyzer, the Memory Profiler allows you to load two data sets (memory snapshots) to compare them. This is especially useful when looking at how memory usage grew over time or between scenes and when searching for memory leaks.
Memory Profiler has a number of tabs in the main window that allow you to dig into memory snapshots including Summary, Objects and Allocations, and Fragmentation. Let’s look at each of these options in detail.
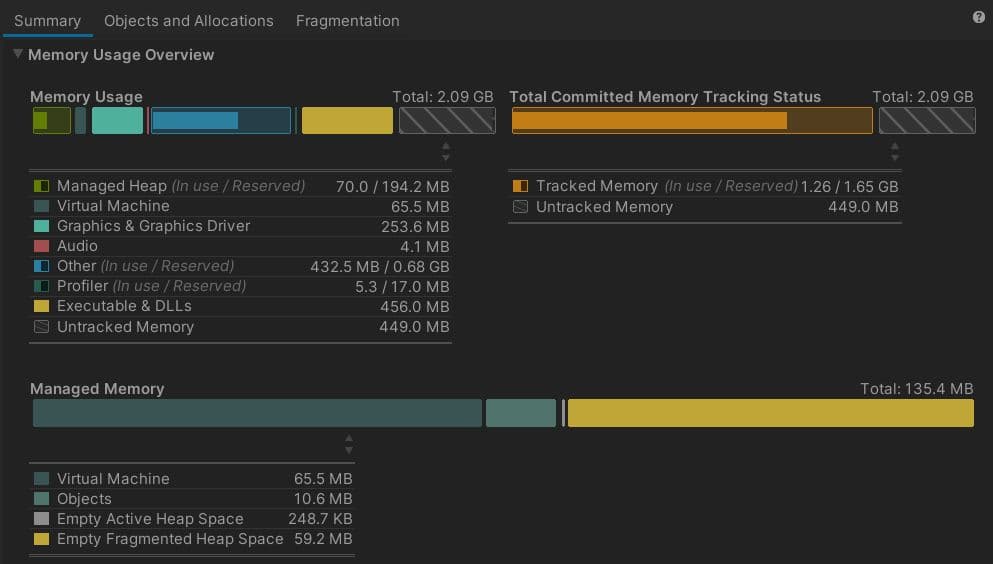
The Summary view
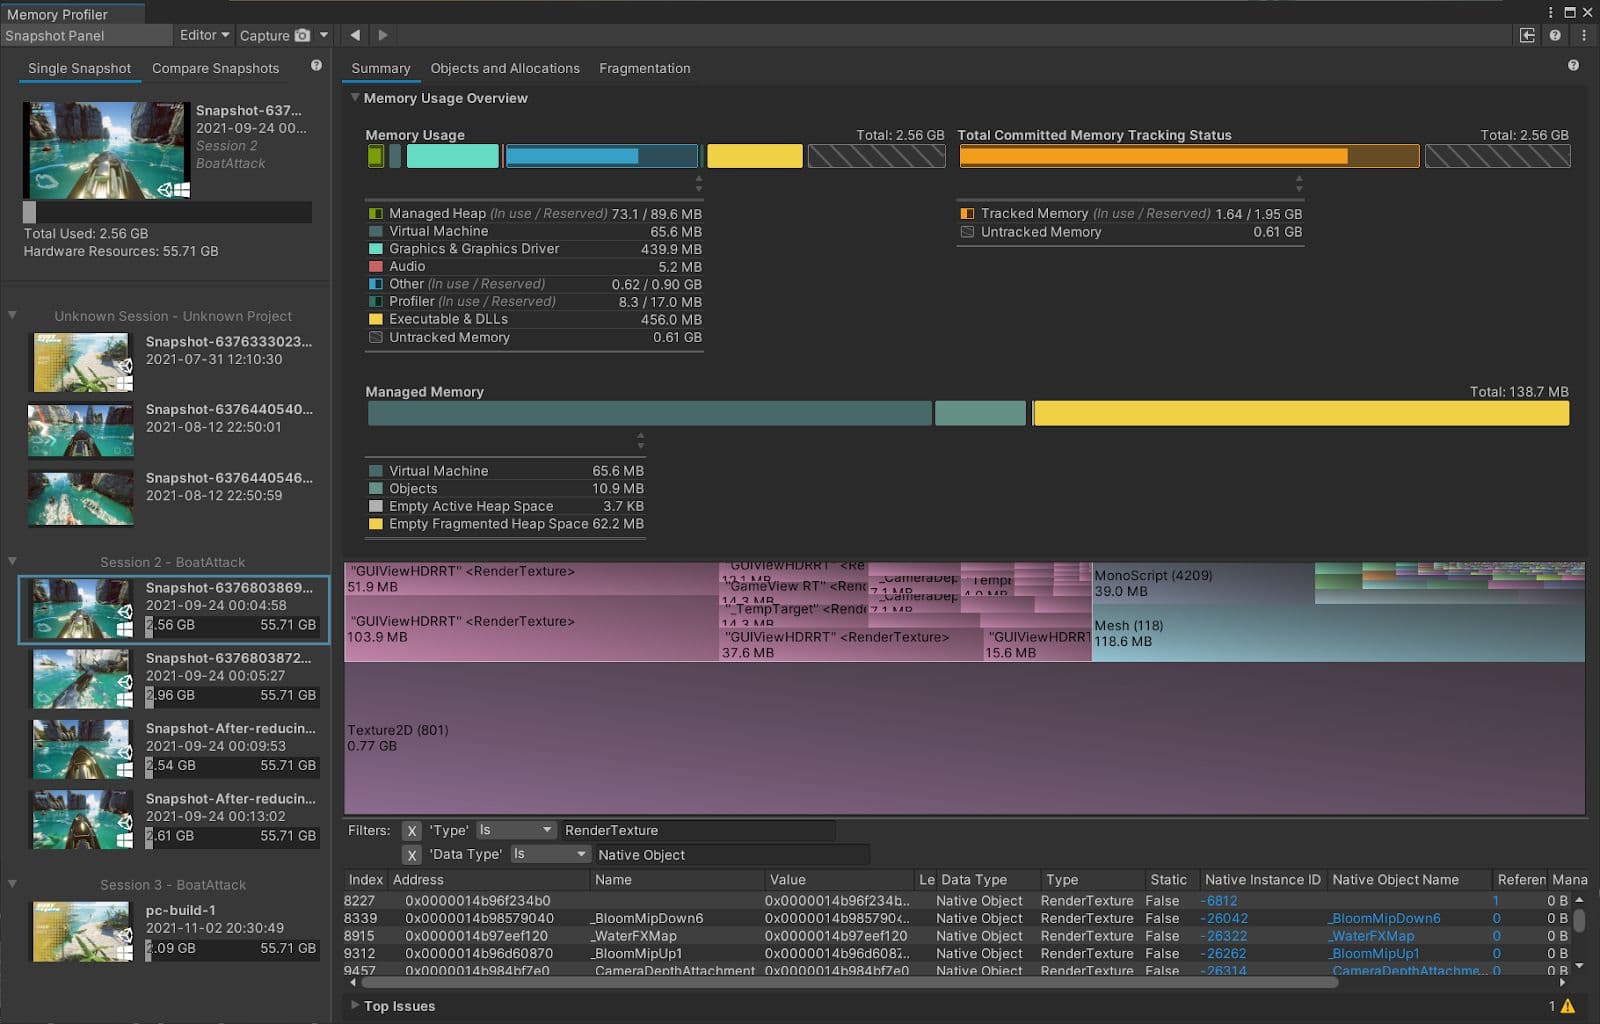
Choose this view when you want to get a quick overview of a project’s memory usage. It also contains useful and important memory related figures for the captured memory snapshot in question. It’s perfect for a quick glance at what’s going on at the point in time when a snapshot was taken.

Graphical Tree Map
The Tree Map view displays a breakdown of the memory used by Objects as a graphical Tree Map that you can drill into to discover the type of Objects that consume the most memory.

Tree Map: Filtered table
Below the Tree Map view is a filtered table that updates to display the list of objects in the selected grid cells.
The Tree Map shows memory attributed to Objects, either Native or Managed. Managed Object memory tends to be dwarfed by Native Object memory, making it harder to spot in the map view. You can zoom in on the Tree Map to look at these, but for inspecting smaller objects, tables usually provide a better overview. Clicking cells in the Tree Map will filter the table below it to the type of the section and/or select the specific object of interest in the table.
You can track down which items reference objects in this list and possibly which Managed class fields these references reside in by selecting the table row or the Tree Map grid cell that represents it, then checking the References Section in the Details side panel. If the side is hidden, you can make it visible via a toggle button in the window’s top right hand part of the toolbar.
Note: The Tree Map only shows Objectsin memory. It’s not a full representation of tracked memory. This is important to understand in case you notice that the Memory Usage Overview numbers are not the same as the Tracked Memory total.
This results from the fact that not all native memory is tied to Objects. It can also consist of non-Object-associated Native Allocations such as executables and DLLs, NativeArrays, and so on. Even more abstract concepts such as “Reserved but unused memory space” can play into the Native Allocations total.
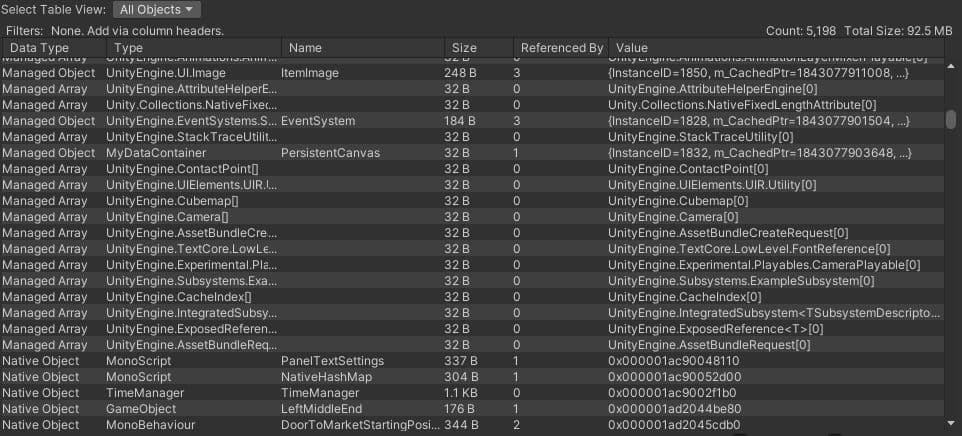
Objects and Allocations
The Objects and Allocations view shows a table that can be switched to filter based on ready-made selections, such as All Objects, All Native Objects, All Managed Objects, All Native Allocations, and more.
You can switch the bottom table to display the Objects, Allocations, or Memory Regions in the selected range. As noted for the Tree Map view, not all memory is associated with Objects, so the All Memory Regions and All Native Allocations pages can provide a more complete picture of your memory usage, where the Memory Regions also includes reserved but currently unused memory.
Use this to your advantage when optimizing memory usage and aiming to pack memory more efficiently for hardware platforms where memory budgets are limited.
Memory profiling techniques and workflows
Load a Memory Profiler snapshot and go through the Tree Map view to inspect the categories, ordered from largest to smallest in memory footprint size.
Project assets are often the highest consumers of memory. Using the Table view, locate Texture objects, Meshes, AudioClips, RenderTextures, Shaders, and preallocated buffers. These are all good candidates for memory optimization.
Locating memory leaks
A memory leak typically happens when:
- An object is not released manually from memory through the code
- An object stays in memory because of an unintentional reference
The Memory Profiler Compare mode can help find memory leaks by comparing two snapshots over a specific timeframe.
A common memory leak scenario in Unity games can occur after unloading a scene.
The Memory Profiler package has a workflow that guides you through the process of discovering these types of leaks using the Compare mode.
Locating recurring memory allocations over application lifetime
Through differential comparison of multiple memory snapshots, you can identify the source of continuous memory allocations during application lifetime.
The following sections list some tips to help identify managed heap allocations in your projects.
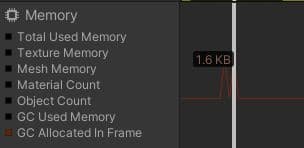
Locating memory allocations
The Memory Profiler module in the Unity Profiler represents managed allocations per frame with a red line. This should be 0 most of the time, so any spikes in that line indicate frames you should investigate for managed allocations.
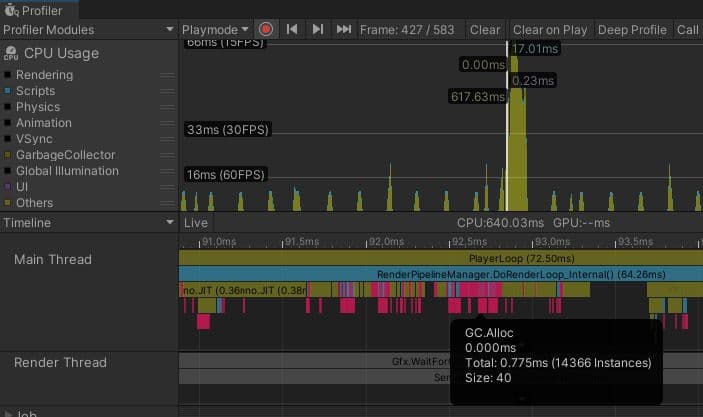
Timeline view in the CPU Usage Profiler module
The Timeline view in the CPU Usage Profiler module shows allocations, including managed ones, in pink, making them easy to see and hone in on.
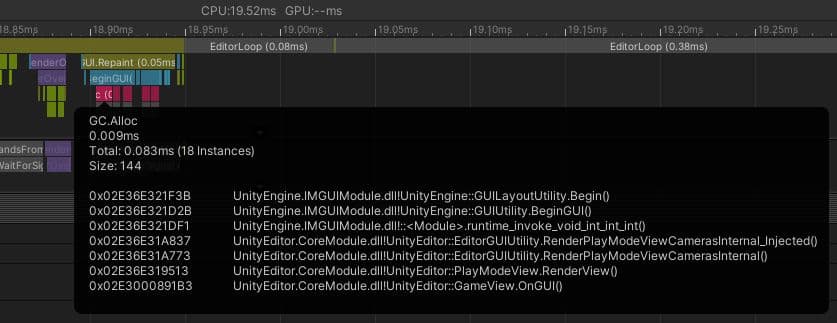
Allocation call stacks
Allocation call stacks provide a quick way to discover managed memory allocations in your code. These will provide the call stack detail you need at less overhead compared to what deep profiling would normally add, and they can be enabled on the fly using the standard Profiler.
Allocation call stacks are disabled by default in the Profiler. To enable them, click the Call Stacks button in the main toolbar of the Profiler window. Change the Detailsview to Related Data.
Note: If you’re using an older version of Unity (prior to Allocation call stack support), then deep profiling is a good way to get full call stacks to help find managed allocations.
GC.Alloc samples selected in the Hierarchy or Raw Hierarchy will now contain their call stacks. You can also see the call stacks of GC.Alloc samples in the selection tooltip in Timeline.

The Hierarchy view in the CPU Usage Profiler
The Hierarchy view in the CPU Usage Profiler lets you click on column headers to use them as the sorting criteria. Sorting by GC Alloc is a great way to focus on those.
Project Auditor
Project Auditor is an experimental static analysis tool. It does a lot of useful things, several of which are outside the scope of this guide, but it can produce a list of every single line of code in a project which causes a managed allocation, without ever having to run the project. It’s a very efficient way to find and investigate these sorts of issues.
Memory and GC optimizations
Unity uses the Boehm-Demers-Weiser garbage collector, which stops running your program code and only resumes normal execution once its work is complete.
Be aware of unnecessary heap allocations that can cause GC spikes.
- Strings: In C#, strings are reference types, not value types. This means that every new string will be allocated on the managed heap, even if it’s only used temporarily. Reduce unnecessary string creation or manipulation. Avoid parsing string-based data files such as JSON and XML, and store data in ScriptableObjects or formats like MessagePack or Protobuf instead. Use the StringBuilder class if you need to build strings at runtime.
- Unity function calls: Some Unity API functions create heap allocations, particularly ones which return an array of managed objects. Cache references to arrays rather than allocating them in the middle of a loop. Also, take advantage of certain functions that avoid generating garbage. For example, use GameObject.CompareTag instead of manually comparing a string with GameObject.tag (as returning a new string creates garbage).
- Boxing: Avoid passing a value-typed variable in place of a reference-typed variable. This creates a temporary object, and the potential garbage that comes with it implicitly converts the value type to a type object (e.g., int i = 123; object o = i). Instead, try to provide concrete overrides with the value type you want to pass in. Generics can also be used for these overrides.
- Coroutines: Though yield does not produce garbage, creating a new WaitForSeconds object does. Cache and reuse the WaitForSeconds object rather than creating it in the yield line or use yield return null.
- LINQ and Regular Expressions: Both of these generate garbage from behind-the-scenes boxing. Avoid LINQ and Regular Expressions if performance is an issue. Write for loops and use lists as an alternative to creating new arrays.
- Generic Collections and other managed types: Don’t declare and populate a List or collection every frame in Update (for example, a list of enemies within a certain radius of the player). Instead, make the List a member of the MonoBehaviour and initialize it in Start. Simply empty the collection with Clear every frame before using it.
Time garbage collection whenever possible
If you are certain that a garbage collection freeze won’t affect a specific point in your game, you can trigger garbage collection with System.GC.Collect.
See Understanding Automatic Memory Management for examples of how to use this to your advantage.
Use the Incremental Garbage Collector to split the GC workload
Rather than creating a single, long interruption during your program’s execution, incremental garbage collection uses multiple, shorter interruptions that distribute the workload over many frames. If garbage collection is causing an irregular frame rate, try this option to see if it can reduce the problem of GC spikes. Use the Profile Analyzer to verify its benefit to your application.
Note that using the GC in Incremental mode adds read-write barriers to some C# calls, which comes with some overhead that can add up to ~1 ms per frame of scripting call overhead. For optimal performance, it’s ideal to have no GC Allocs in the main gameplay loops so that you don’t need the Incremental GC for a smooth frame rate and can hide the GC.Collect where a user won’t notice it, for example when opening the menu or loading a new level.
To learn more about the Memory Profiler check out the following resources:

Download the e-book Ultimate guide to profiling Unity gamesfor free to get all the tips and best practices.