Tools for profiling and debugging
Smooth performance is essential to creating great gaming experiences that reach a broad range of devices and players. Unity provides a full set of profiling and memory management tools that Unity developers can use alongside the native profiling tools available for their target platforms.
In this article we provide you with an overview of the profiling and debugging tools available with Unity and those available for target platforms.
The information here is excerpted from the e-book, Ultimate guide to profiling Unity games (Unity 6 edition), available to download for free. The e-book was created by both external and internal Unity experts in game development, profiling, and optimization.
Use both Unity and native tools for the best results
Lean, performant code and optimized memory usage lead to a better user experience across low- and high-end devices. This applies for everything, from being able to reach more users on the low-end devices by tackling heat and battery consumption, to your players’ comfort levels, and ultimately, factors that drive higher adoption and retention. It can also be a requirement for passing distribution platform specifications.Profiling is like detective work, unraveling the mysteries of why performance in your application is lagging, or why code is allocating excess memory.
The best gains from profiling are made when you plan early on in your project’s development lifecycle. It’s an ongoing proactive and iterative process. By profiling early and often, rather than just before you are about to ship your game, you and your team can understand and establish a “performance signature” for the project. If performance takes a nosedive, for instance, you’ll be able to easily spot when things go wrong, and quickly remedy the issue.
The most accurate profiling results come from running and profiling builds on target devices, as well as using platform-specific tooling to dig into the hardware characteristics of each targeted platform.
Unity ships with a range of free and powerful profiling tools for analyzing and optimizing your code, both in-Editor and on hardware. There are also several great native profiling tools designed for each target platform, such as those available from the major platform owners. Using a combination of both provides a more holistic view of application performance across all target devices.

Unity profiling tools
Unity’s profiling tools are available in the Editor and via the Package Manager. These tools, along with the Unity Frame Debugger, are covered in more detail in the e-book Ultimate guide to profiling Unity games (Unity 6 edition).
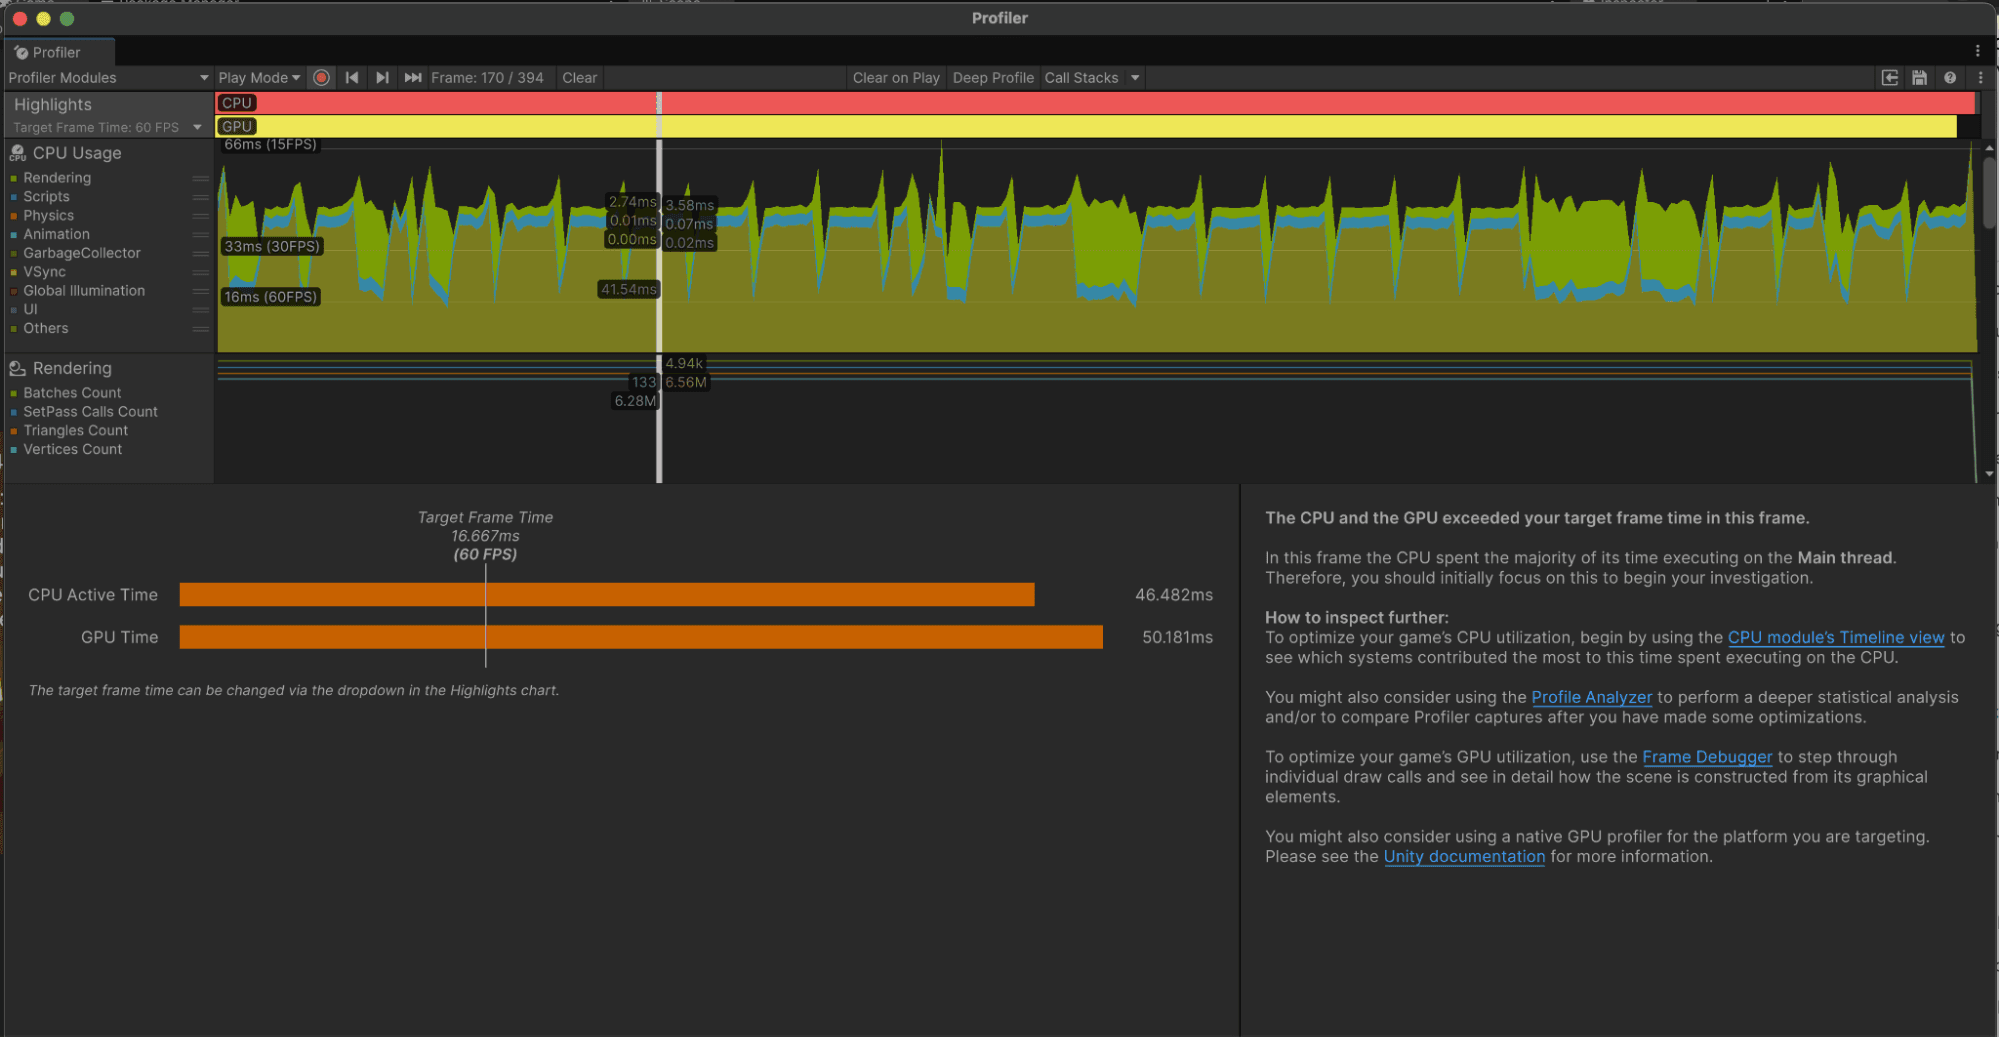
- The Unity Profiler measures the performance of the Unity Editor, and your application in Play mode or development mode while connected to a device.
- The Profiling Core package provides APIs that you can use to add contextual information to Unity Profiler captures.
- The Memory Profiler provides in-depth analysis of how much memory your game is using and what objects are using it.
- The Profile Analyzer enables you to compare two profiling datasets side by side to analyze how your changes affect your application’s performance.
- The Project Auditor reports insights and issues about the scripts, assets, and code in your project, many of which relate to performance.
Unity also offers several debugging tools that complement its suite of profiling tools. The Rendering Debugger's Display Stats panel, for example, allows you to see a limited set of performance numbers and markers (CPU + GPU) on development builds without having the Editor connected.

Native profiling tools
Android / Arm
- Android Studio:The latest Android Studio includes a new Android Profiler that replaces the previous Android Monitor tools. Use it to gather real-time data about hardware resources on Android devices.
- Arm Performance Studio: A suite of tools to help you profile and debug your games in great detail, catered for devices running Arm hardware.
- Snapdragon Profiler: Specifically for Snapdragon chipset devices only. Analyze CPU, GPU, DSP, memory, power, thermal, and network data to help find and fix performance bottlenecks.
Intel
- Intel VTune: Quickly find and fix performance bottlenecks on Intel platforms with this suite of tools. For Intel processors only.
- Intel GPA suite: A suite of graphics focused tools to help you improve your game’s performance by quickly identifying problem areas.
Xbox / PC
- PIX: PIX is a performance tuning and debugging tool for Windows and Xbox game developers using DirectX 12. It includes tools for understanding and analyzing CPU and GPU performance as well as monitoring various real-time performance counters.
PC / Universal
- AMD μProf: AMD uProf is a performance analysis tool for understanding and profiling performance for applications running on AMD hardware.
- NVIDIA NSight: Tooling that enables developers to build, debug, profile, and develop class-leading and cutting-edge software using the latest visual computing hardware from NVIDIA.
- Samply: Samply is an open source command line CPU profiler which uses the Firefox profiler as its UI. It works on macOS, Linux, and Windows.
- Superluminal: Superluminal is a high-performance, high-frequency profiler that supports profiling applications on Windows, Xbox One, and PlayStation written in C++, Rust and .NET. It is a paid product, though, and must be licensed to be used. Check out our discussions article for a quick intro on how to get started.
PlayStation
- CPU profiler tools are available for PlayStation hardware. For more details, you need to be a registered PlayStation® developer, start here.
iOS
- Xcode Instruments and the XCode Frame Debugger: Instruments is a powerful and flexible performance-analysis and testing tool that’s part of the Xcode toolset.
WebGL
- Firefox Profiler: Dig into the call stacks and view flame graphs for Unity WebGL builds (among other things) with the Firefox Profiler. It also features a comparison tool to look at profiling captures side by side.
- Chrome DevTools Performance: Another web browser tool that can be used to profile Unity WebGL builds.

GPU debugging and profiling tools
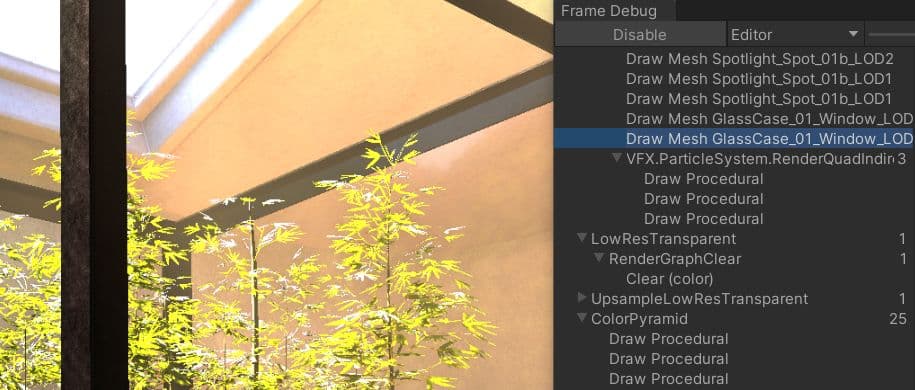
While the Unity Frame Debug tool captures and illustrates draw calls that are sent from the CPU, the following tools can help show you what the GPU does when it receives those commands.
Some are platform-specific and offer closer platform integration. Take a look at the tools relevant to the platforms of interest:
- Arm Streamline: Part of Arm’s Performance Studio software suite, focusing on low-overhead performance measurement of the CPU and GPU.
- Arm Frame Advisor: Part of Arm’s Performance Studio software suite, focusing on frame-based API profiling.
- RenderDoc: GPU debugger for desktop and mobile platforms, focusing on frame-based API debugging.
- Intel GPA: Graphics profiling for Intel-based platforms
- Apple Frame Capture Debugging Tools: GPU debugging for Apple platforms
- Visual Studio Graphics Diagnostics: Choose this and/or PIX for DirectX-based platforms such as Windows or Xbox
- NVIDIA Nsight Frame Debugger: OpenGL-based frame debugger for NVIDIA GPUs
- AMD Radeon Developer Tool Suite: GPU profiler for AMD GPUs
- Xcode frame debugger: For iOS and macOS.

You can find many more best practices and tips for advanced Unity developers and creators from the Unity best practices hub. Choose from over 30 guides, created by industry experts, and Unity engineers and technical artists, that will help you develop efficiently with Unity’s toolsets and systems.