Use all of Unity 6's profiling tools in the smartest and most efficient way


Profiling is necessary for ensuring your game runs on performant code and optimized memory usage, across low- and high-end devices. It can also help it to pass certain distribution platform specifications before it’s even released.
In turn, great cross-platform performance that doesn’t max out heat and battery consumption is a major building block for your ultimate goal – to reach as big an audience as possible on their preferred gaming platforms.
Our updated profiling e-book, The ultimate guide to profiling Unity games (Unity 6 edition), is now available for download. You’ll get almost 100 pages of tips on how to profile an application, manage its memory, and optimize its power consumption with Unity 6 tools – the Unity Profiler, Profile Analyzer, Memory Profiler (both the built-in module and the package), Frame and Rendering Debuggers, Project Auditor, and more.

Some of the most useful tools in your game dev toolbelt
Our team released the Unity 2022 LTS version of the profiling guide because we heard from users that profiling can be somewhat overwhelming. So we thought it would help to provide Unity devs with a primer guide that breaks down the tools, and that explains foundational profiling techniques and when to use what. So far, it’s been one of our most popular e-books.
As a veteran developer and an attendee at a Unite conference a few years ago said to me, “profiling is probably one of the most useful tools to add to your toolbelt as a developer”. Profilers are like detective tools that help you unravel the mysteries of why performance in your application is lagging or why code is allocating excess memory – they reveal what’s going on under the hood.
Once you understand how to profile your project effectively, all your key game development decisions can be guided by thoughtful consideration of how to get the best possible performance for your creative goals.
A look inside the guide
All of the e-books our team releases are a result of collaboration between subject matter experts, including colleagues from Unity engineering teams. For our profiling e-book, we teamed up with several Unity engineers, as well as our friends from Arm, who provided their unique insights to the hardware, including helping us map out a collection of platform-specific profiling tools we list at the end of the guide.

So, what are the highlights of the profiling e-book?
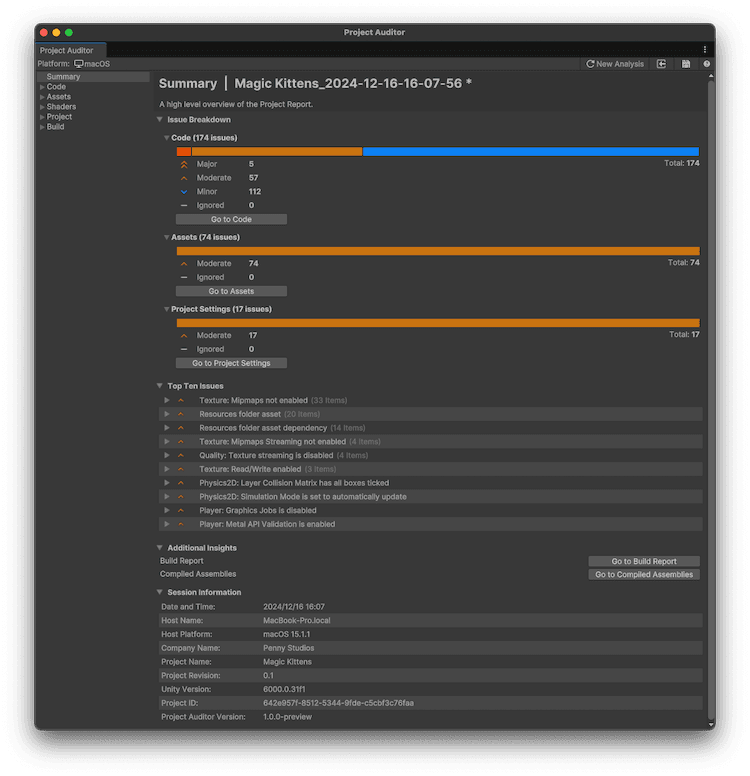
Unity 6 product news and updates: The e-book includes the improvements that have been made across the entire suite of profiling tools so you can use it with confidence as a reference, along with Unity documentation, for your Unity 6 projects. For example, it covers the Project Auditor that is available as a package with Unity 6.1. This is a powerful analysis tool for Unity projects, designed to help developers optimize performance, maintain best practices, and identify potential issues and bottlenecks in their projects.
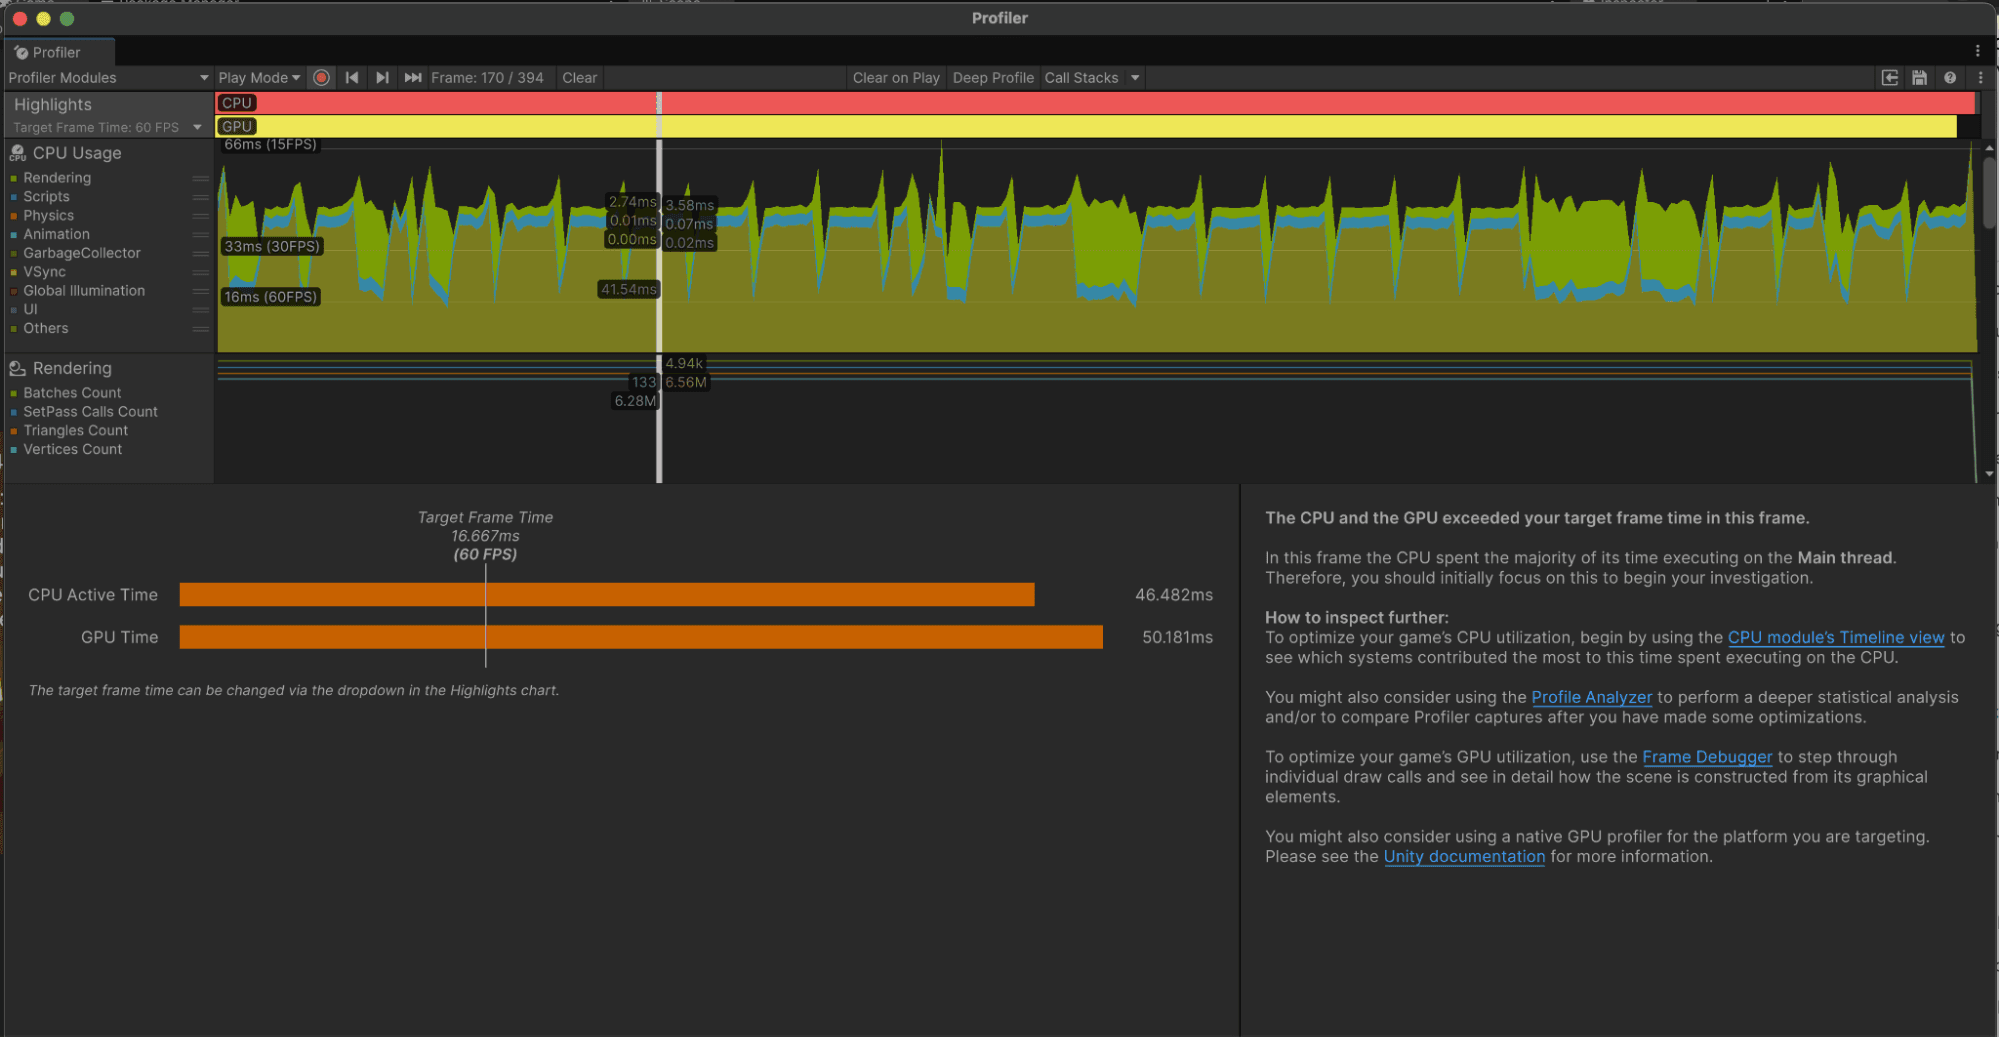
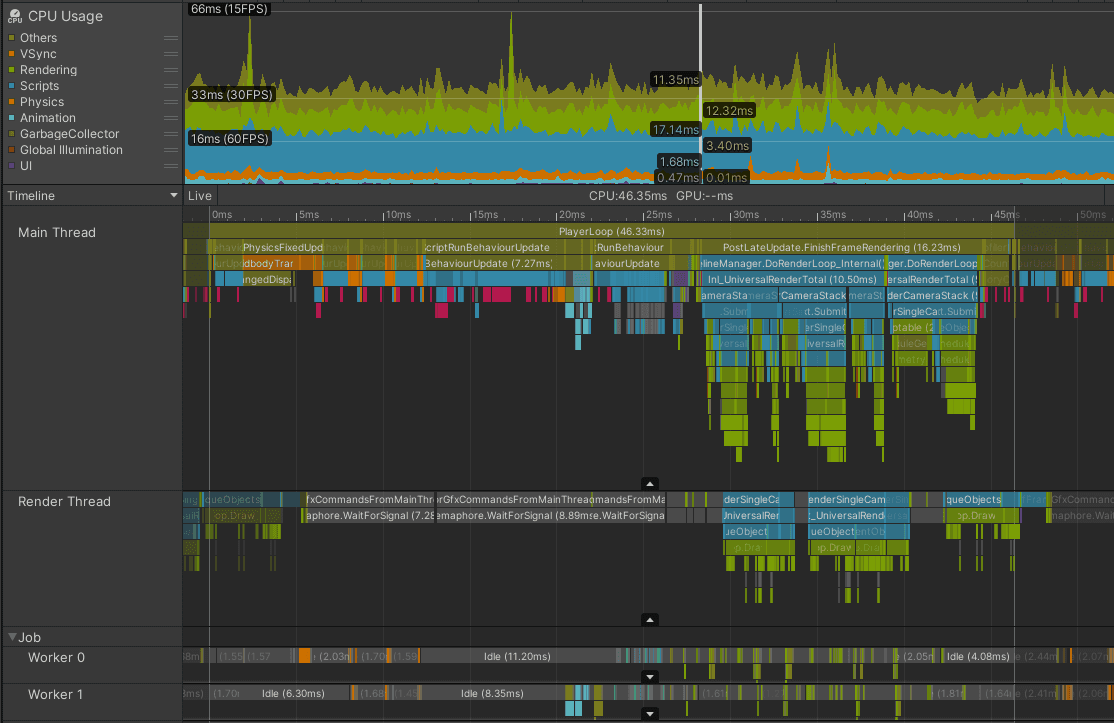
Explanations of core performance concepts: Beyond the tools themselves, the e-book also explains concepts like understanding frame budget, the anatomy of a frame, sample vs instrumentation-based profiling, establishing a profiling methodology, being CPU-bound vs GPU-bound, and mobile thermal control and battery lifetime.
When and how to profile: You’ll get tips for how to define budgets and systematically benchmark results to ensure you stay on track, including an introduction to specific constraints on mobile. We also look at common pitfalls and bottlenecks, and the tools to address them.
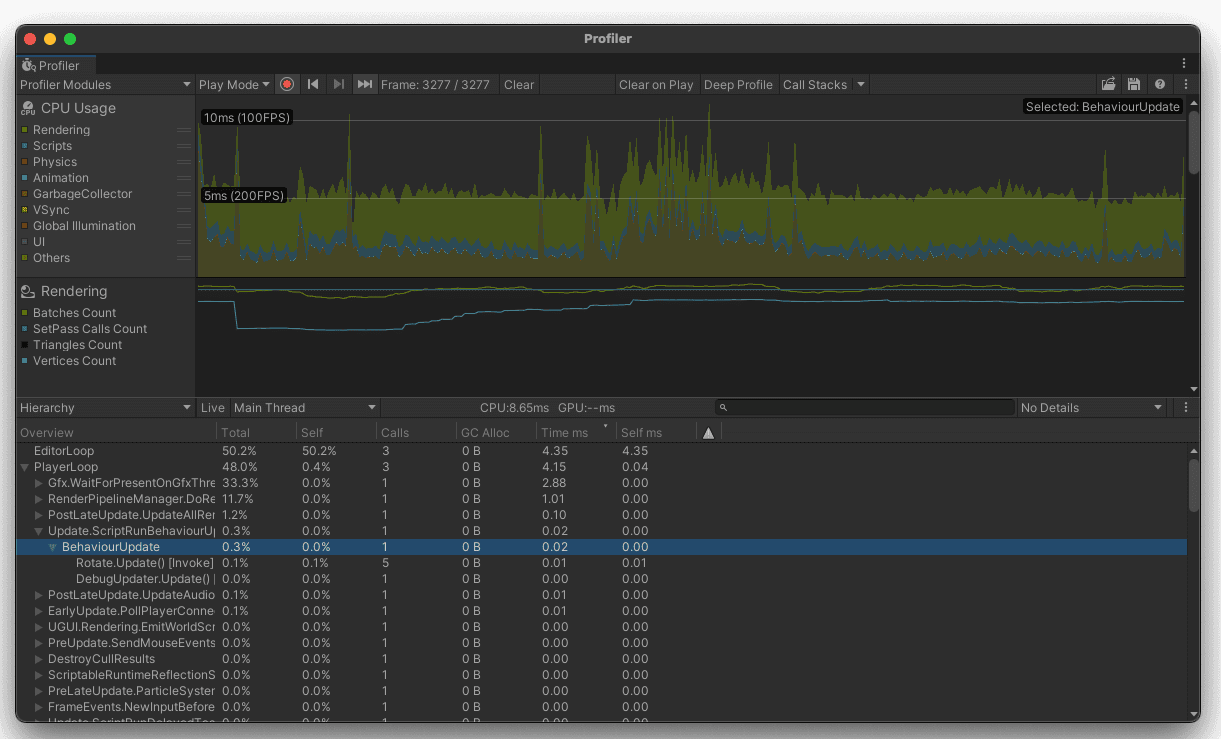
And of course, a complete walkthrough (with tons of tips) of Unity profiling tools: For each tool, you’ll get a quick-start introduction and actionable tips for using them most efficiently. We also expand focus beyond profiling to look into debugging and, as mentioned earlier, we list the native profiling tools provided by the different platform holders, like Arm Performance Studio.

I hope you’ll download our new profiling guide and find it useful. It’s just one of many recently updated e-books for Unity 6, including our two performance optimization guides that we announced in this blog post.

You’ll find all of the e-books and articles for advanced Unity developers, artists, and technical artists in the Unity best practices hub and the best practices guides section of Unity documentation.