
How to ensure code quality and maintainability with Roslyn analyzers
This article explains how a Roslyn analyzer can help you debug and improve the quality of your game code in Unity.
A Roslyn analyzer is a code analysis tool that uses the Roslyn compiler platform’s APIs to analyze C# code in real-time. An analyzer can provide code improvement suggestions, warnings, or errors based on a set of predefined rules. It works as a plug-in for Microsoft Visual Studio and Microsoft Visual Studio Code, complementing the IntelliSense capabilities in both these code editors.
Roslyn analyzers build on the suggestions, completions, and information about available APIs provided by IntelliSense with additional tools to analyze and identify potential issues in your code. Additionally, you’ll get suggestions for possible fixes using the APIs of a Roslyn compiler platform.
Roslyn analyzers are useful to enforce standards and warn you if you breach a code convention. In addition, they can often help fix those code errors or style breaches.
Visual Studio comes with many default analyzers that are part of the Open Source repo for Roslyn and a good resource for learning more about debugging with this method.
Note: Most of this article applies to Windows only. Roslyn analyzers are also available to use with Visual Studio for macOS, but the support for inspecting them is limited compared to what’s available for Windows.
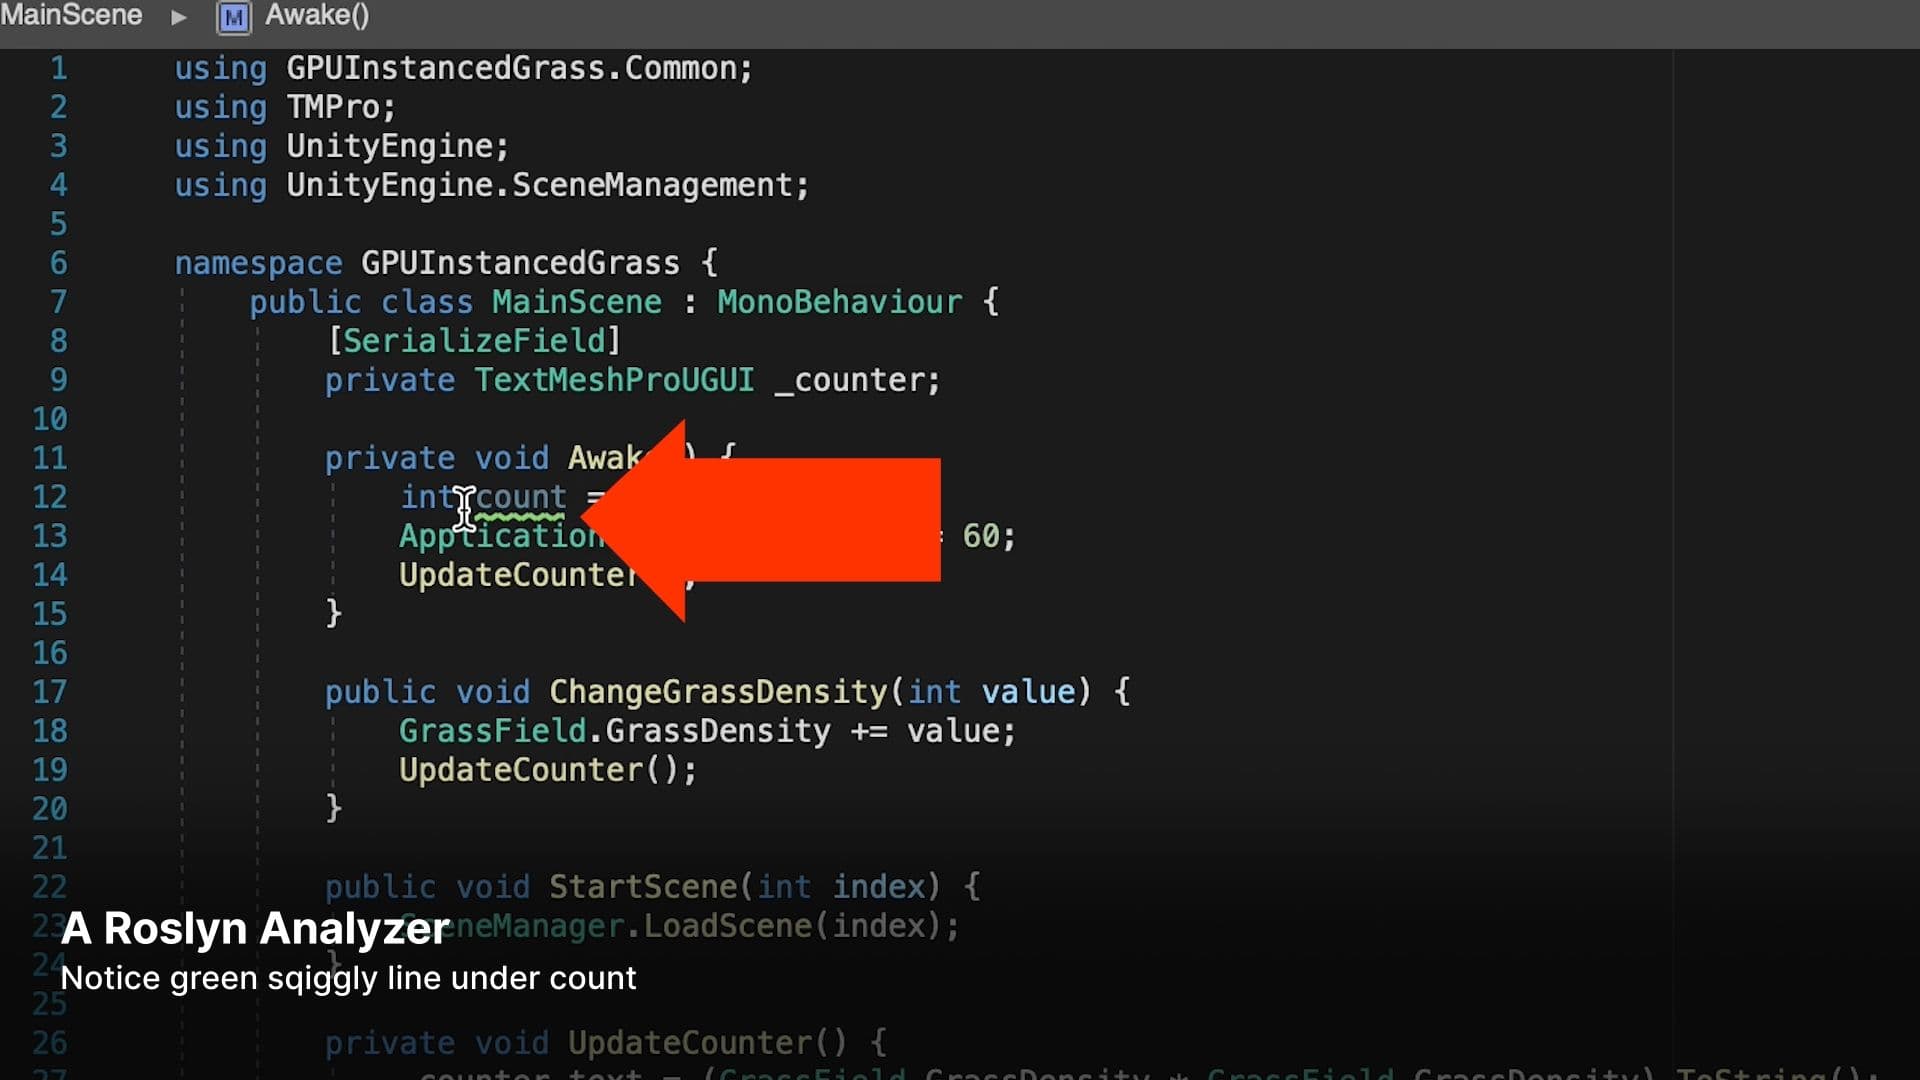
Roslyn analyzer in action
The image above is from a video that shows a typical use of a Roslyn analyzer. In this example, an analysis of the code has spotted an unused variable. The developer is made aware of this issue because the variable count is underlined with a green squiggle. Clicking it shows the issue and a link with options to fix it. In the video, the developer chooses to remove the unused variable based on the recommendation.
In addition to a green squiggle, you might see a red squiggle or gray dots. These different symbols denote the issue’s security level, or how serious the problem is for your code.
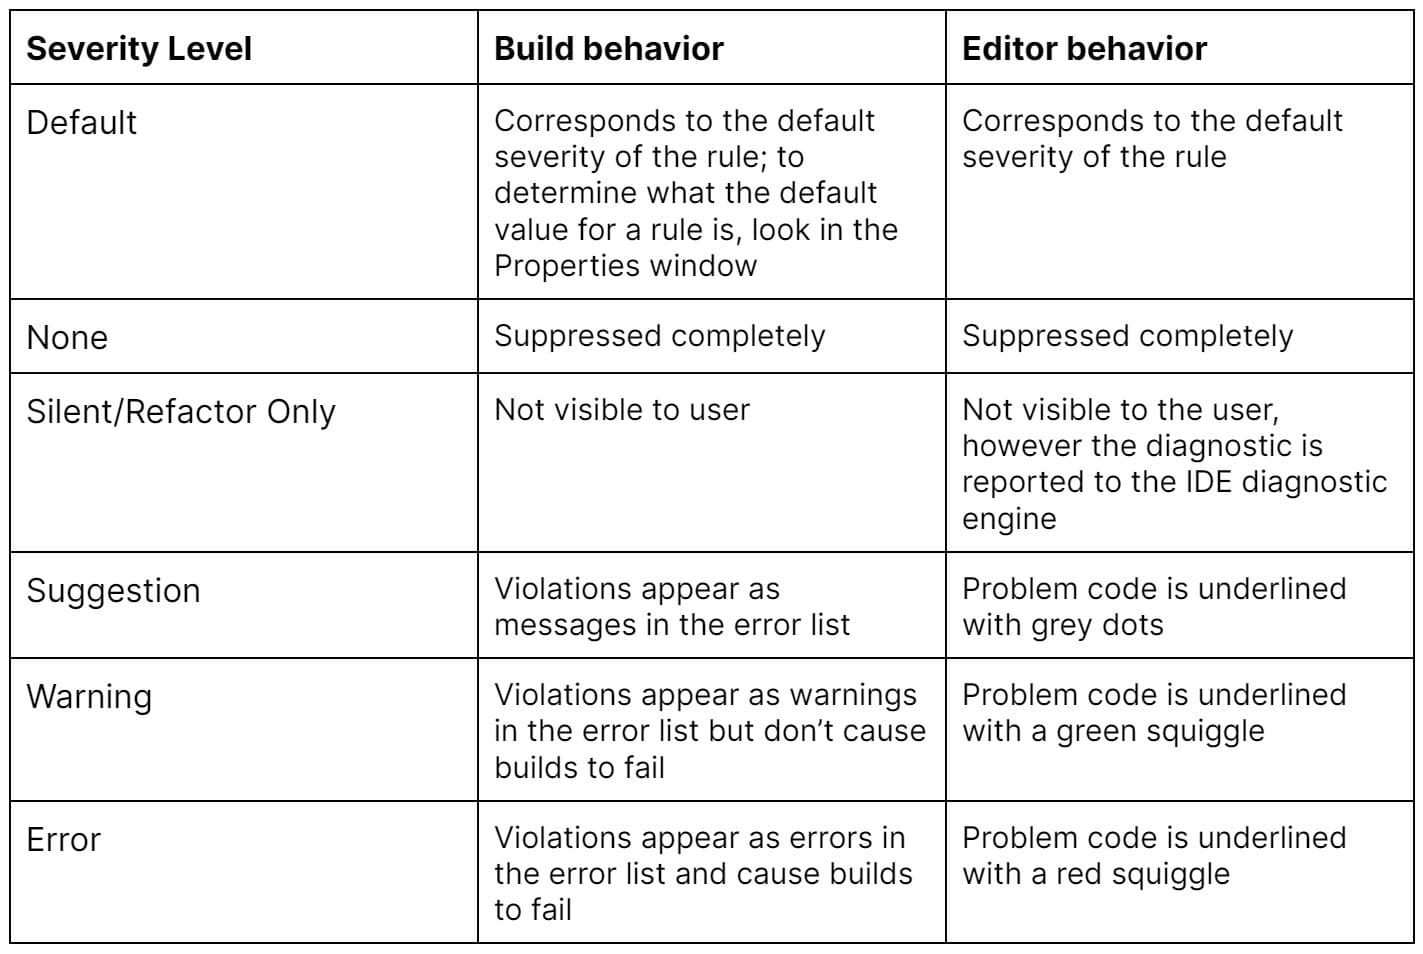
Severity levels
As the table above shows, each analyzer has a user-configurable severity level.
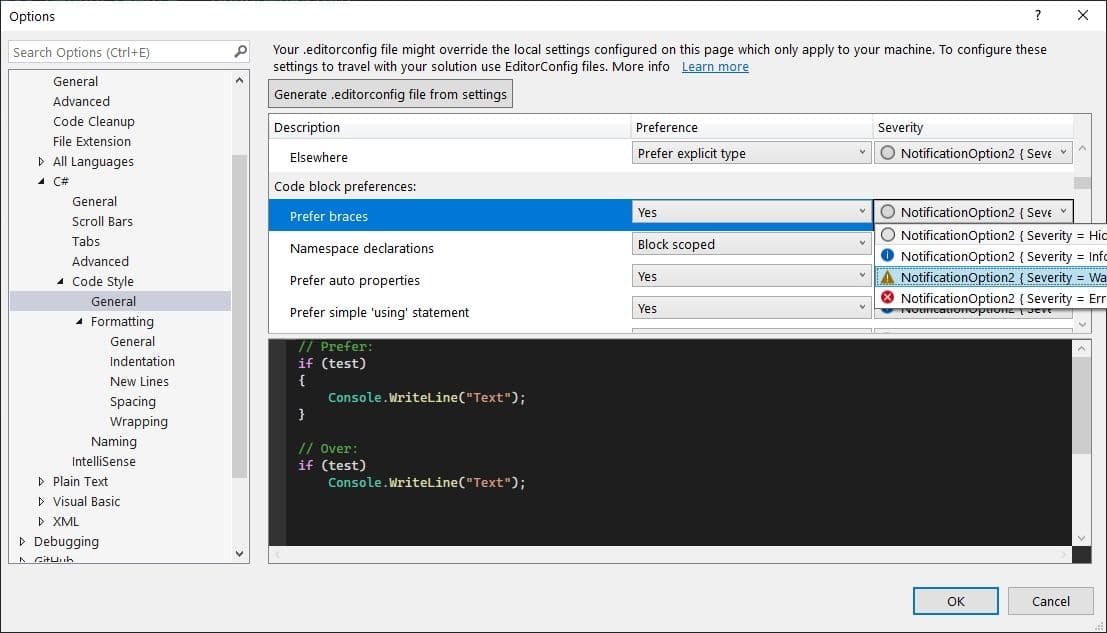
Configuring the built-in analyzers
There are several Roslyn analyzers available, but Visual Studio also comes with some preinstalled. You can adjust the settings of these built-in analyzers in two places. For your local version of Visual Studio, the default settings are adjusted via Tools > Options > Text Editor > C# > Code Style > General. You can change the severity level using the dialog box shown in the image above.
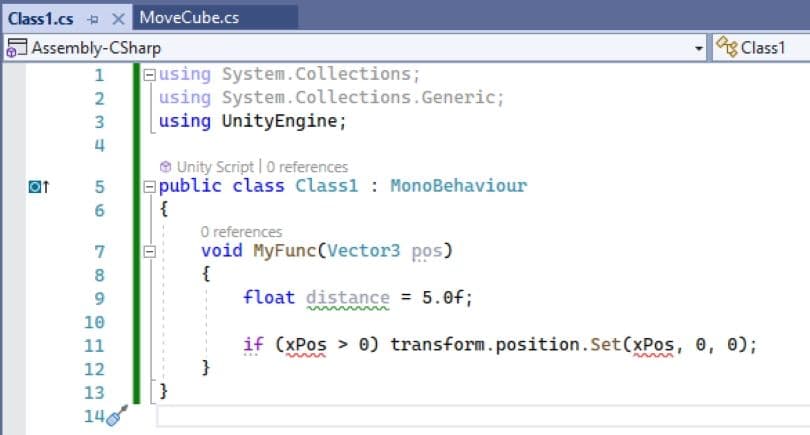
A look at analyzer highlighting
The image above is of a simple code class. The ellipsis symbol (three dots in a line) under the the letters p and o in pos on line 7 and the if statement on line 11 indicate a suggestion. The green squiggle under distance is a warning, and the red squiggle under the two instances of xPos on line 11 is an error. Warnings and errors will also appear in the Errors List window.
Showing potential fixes
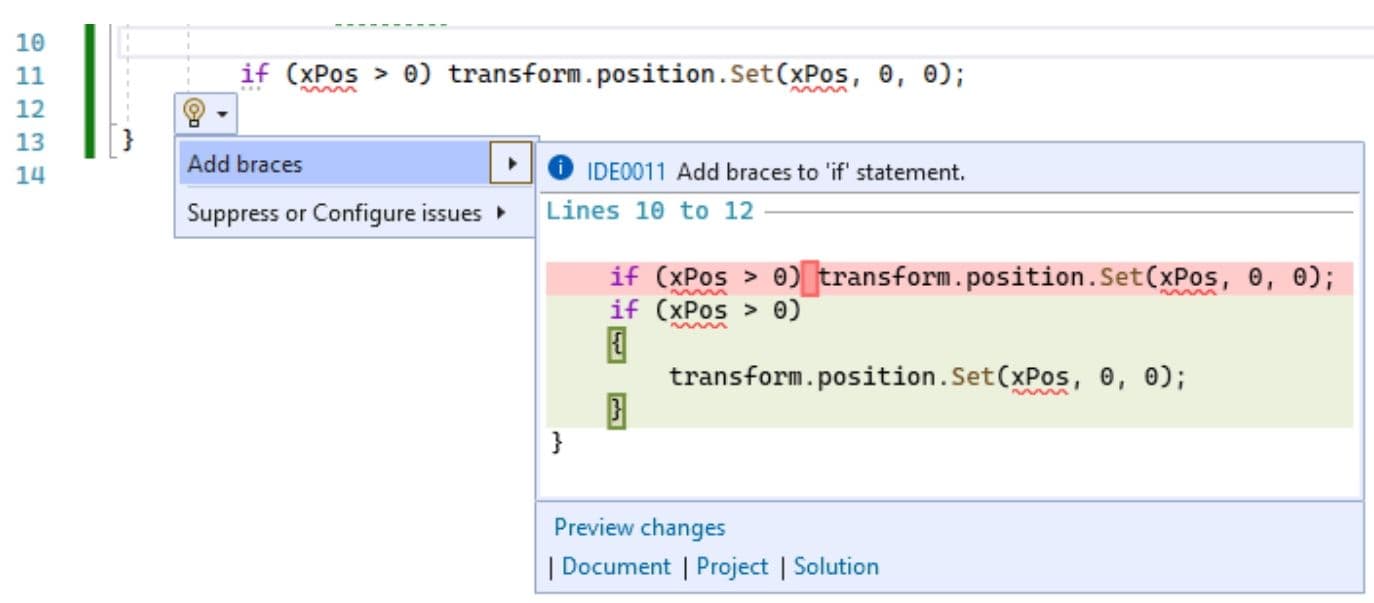
You’ll notice that the image showing settings for built-in analyzers toggles between Refactoring only and the suggestion for Code block preferences: Prefer braces. Refactoring only would hide the ellipsis under the if statement.
If the setting for Prefer braces is a suggestion and you hover over the ellipsis, then you’ll see a panel that shows apotential fixes link. Clicking this shows another panel with the options available. In this case, only one option is available, to add curly braces to the code. The image above shows this sequence.
Adding an .editorconfig file
If you want to ensure code style for a specific project then you can add a .editorconfig file that ships with the project. This can be an efficient way to enforce agreed-upon code style rules across a larger team of many developers.
An .editconfig file allows you to override the settings in your version of Visual Studio via Tools > Options > Text Editor > C#. You can even nest multiple .editorconfig files if needed by placing one at the root and one in a subfolder. The one in the subfolder will then override the one at the root.
The next sections outline how to add a .editorconfig file.

Changing the severity level
Change the severity level of an included analyzer in a code text window.
Via the Solution Explorer
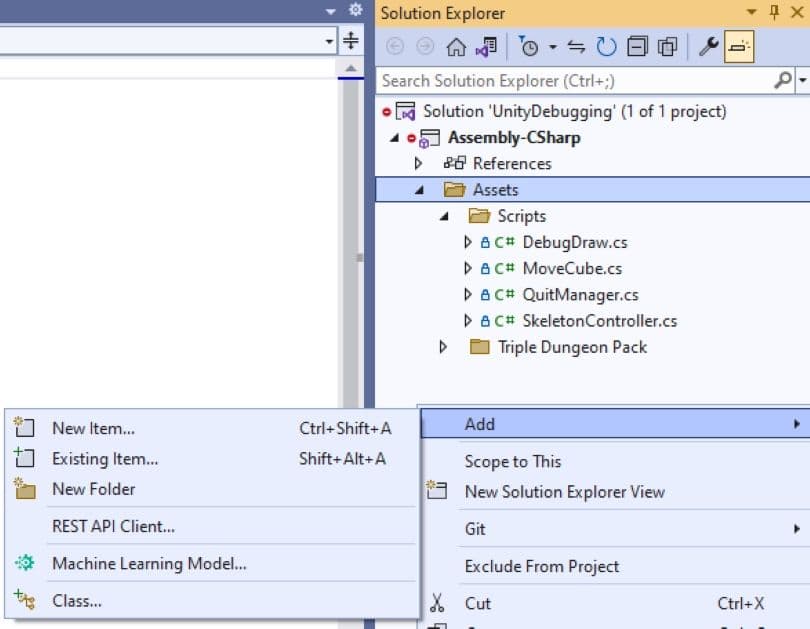
Right-click the Solution Explorer and choose New Item. In the next panel, choose Installed > C# > General editorconfig File (default).
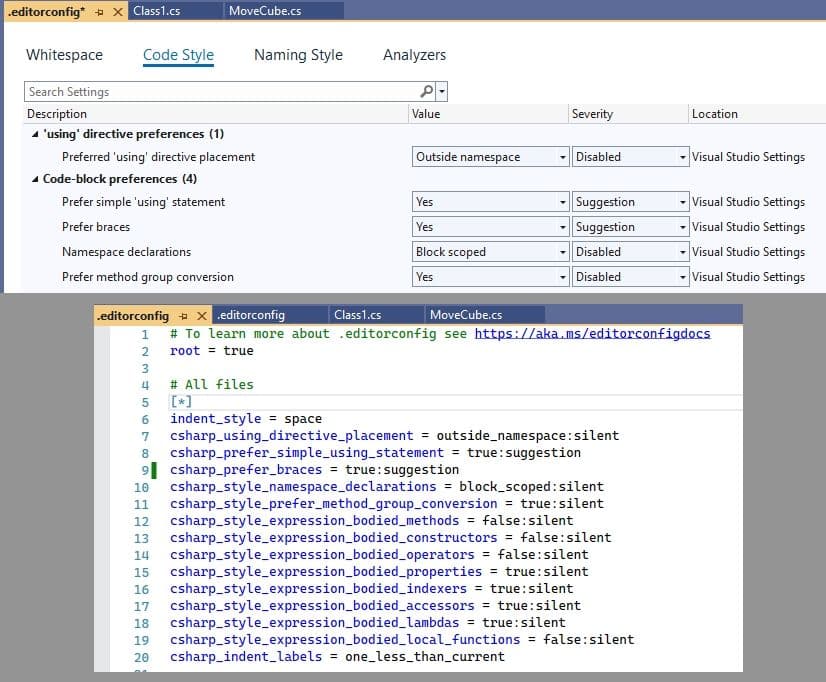
Another option is to select the Generate .editorconfig file from settings in the Tools > Options > Text Editor > C# panel (as seen in the image under Configure built-in analyzers).
Your .editorconfig file
Now that you have an .editorconfig file, Visual Studio (Windows version) displays an editable view of the text file under the hood. Changes to this file will affect C# scripts in the folder where the .editorconfig is saved and any subfolders.
Installing custom analyzers
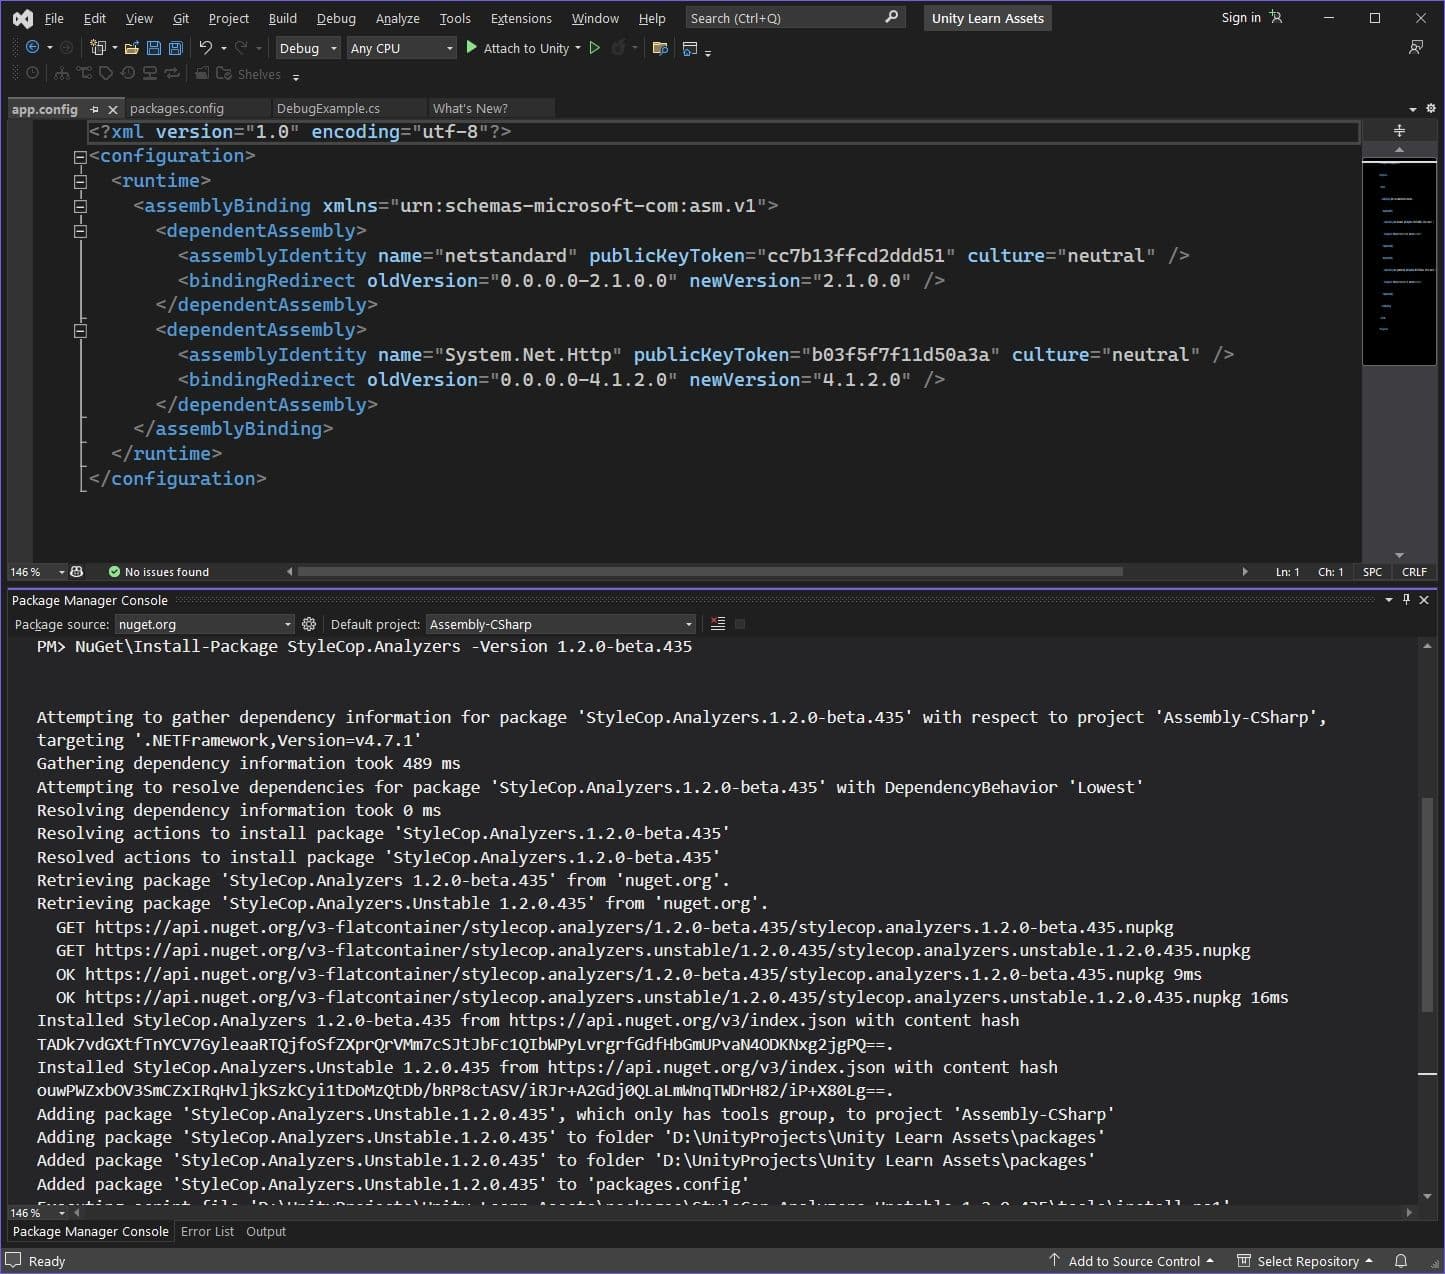
You can extend functionality by adding to the preinstalled Roslyn analyzers. Analyzers are installed as either NuGet packages or Visual Studio extensions (VSIX files). Go to www.nuget.org for the NuGet package installation process. A popular one is the StyleCop.Analyzers, which looks for style issues in your codebase.
Install the package in Visual Studio using the Package Manager Console via Tools > NuGet Package Manager > Package Manager Console. The www.nuget.org page for each analyzer package shows you the command to paste into the Package Manager Console. There’s even a handy button to copy the text to the clipboard.
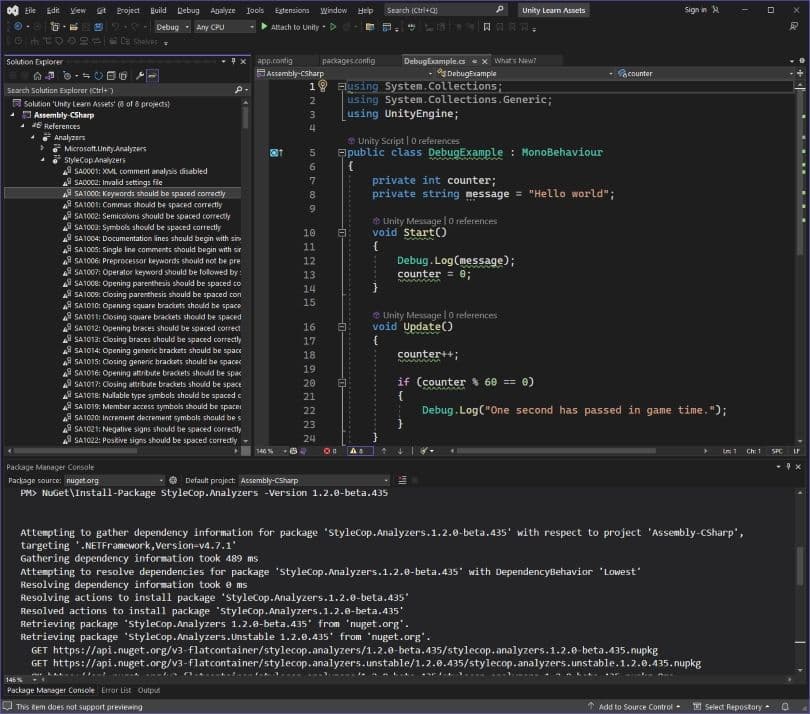
Analyzer assemblies
The analyzer assemblies are installed and appear in Solution Explorer under References > Analyzers.
Install analyzers as VSIX extensions
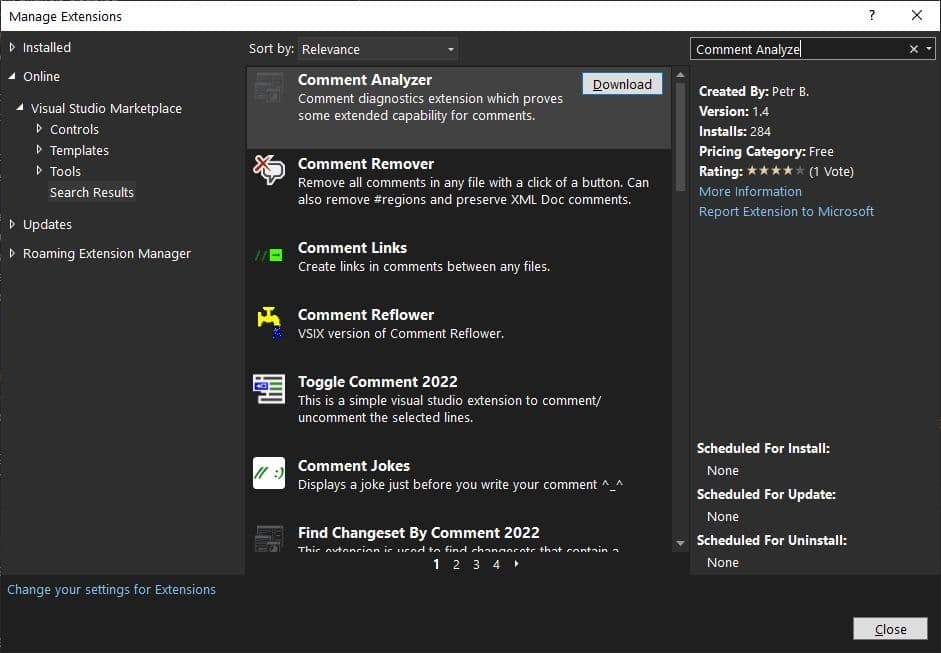
Another option is to install analyzers provided as VSIX extensions. In Visual Studio, select Extensions > Manage Extensions.
If you know the name of the extension, use the search field to find it or simply search for “analyzer.” The image above shows Comment Analyzer selected. Click Download to install the analyzer extension, select OK to close the dialog box, and close all instances of Visual Studio to launch the VSIX Installer.
Select Modify to start the installation. Once the installation completes, select Close and reopen Visual Studio.

Checking the extension installation
If you want to check whether the extension is installed, select Extensions > Manage Extensions. In the Manage Extensions dialog box, select the Installed category on the left, and then search for the extension by name.

More resources
This article focused on built-in Roslyn analyzers available with Visual Studio, but you can also build your own. Analyzers built using the .NET Compiler platform can dramatically improve the quality of your team’s code.
As you become experienced at creating analyzers, you’ll notice how they help your team become more productive with coding issues such as syntax, repetitive edits, guiding with a new library, and more.
A couple of good additional resources by Microsoft include this tutorial on how to create your own C# Roslyn analyzer and this YouTube video on Roslyn analyzers.
Debugging in Unity
Get more tips on debugging your Unity project from these articles:
Advanced technical e-books
Unity provides a number of advanced guides to help professional developers optimize game code. Create a C# style guide: Write cleaner code that scales compiles advice from industry experts on how to create a code style guide to help your team to develop a clean, readable, and scalable codebase.
Another popular guide with our users is 70+ tips to increase productivity with Unity. It’s packed with time-saving tips to improve your day-to-day aggregate workflow with Unity 2020 LTS – tips even experienced developers might have missed out on.
Find all of Unity’s advanced e-books and articles in the Unity best practices hub.