
How to debug your code with Microsoft Visual Studio 2022
Unity supports a variety of code editors, including JetBrains Rider, Atom, and Microsoft Visual Studio Code and Visual Studio. Visual Studio is a built-in package that is installed by default with the Unity Editor.
This article provides tips for using the 2022 edition of the Microsoft Visual Studio debugger, which enables you to fix bugs in your code efficiently. If you’d like to learn more about general productivity tips in Visual Studio, check out our blog post “10 ways to speed up your workflows in the Visual Studio.”
Installing Visual Studio 2022 debugging tools
Visual Studio 2022 has built-in support for Unity, allowing you to easily write and edit scripts, access Unity-specific features, and debug your game code without leaving the IDE. It provides features like IntelliSense code completion, syntax highlighting, and code snippets, which help you write code faster and more efficiently. Additionally, you get debugging tools, including the ability to set breakpoints, step through code, inspect variables, and evaluate expressions at runtime.
Visual Studio is available in several versions including a free community version.
This article is based on the 2022 edition of Visual Studio. The 2019 version has the same features, but the screenshots will differ a little. By default, a new install of Unity will install the community version of Visual Studio, along with an extension called Game Development with Unity that integrates Visual Studio with Unity. If you don’t choose to install Visual Studio, then you can get a copy here. Details on setting up Visual Studio to work with Unity are available here.
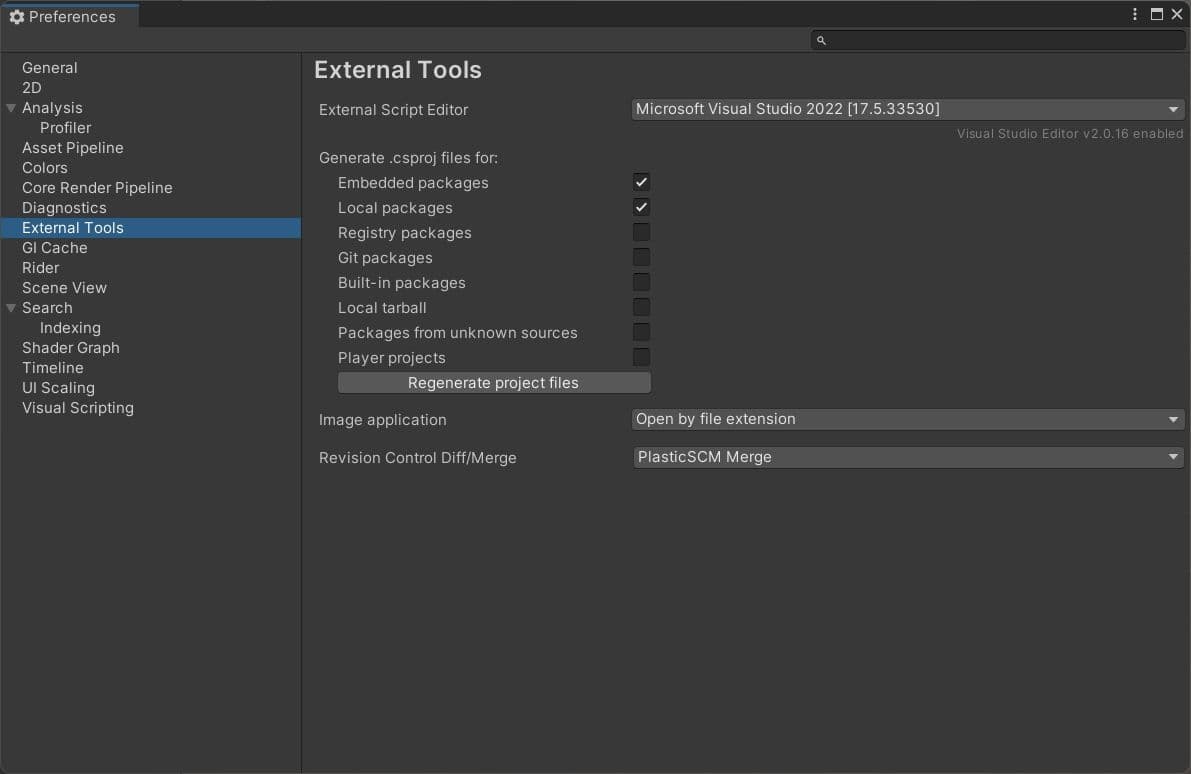
Once you’ve installed Visual Studio in the Unity Editor, open Unity > Preferences > External Tools, and select Visual Studio as the External Script Editor.
Attaching Visual Studio debugger to Unity
In order to enable real-time debugging of your project’s code while it’s running in the Editor, the Visual Studio debugger needs to attach itself to the Editor. This allows the debugger to access and interact with your game’s runtime state. Let’s go through the steps to attach it:
Open the Unity project you want to debug.
In Unity, go to Edit > Preferences (Windows) or Unity > Preferences (macOS), and make sure that Visual Studio is set as the preferred external script editor. If not, select it from the drop-down menu.
Open the desired script in Visual Studio by double-clicking on the script file in the Project view or via the Assets > Open C# Project menu option.
In Visual Studio, go to Debug > Attach Unity Debugger or click the Attach to Unity button in the toolbar. A window will open with a list of available Unity instances.
Select the Unity instance running your project (usually displayed as “Unity Editor (your project name),” and click Attach.
Visual Studio is now connected to Unity, and you can start setting breakpoints and debugging your code. When the game is running in the Editor, the Visual Studio debugger will pause the execution at breakpoints, allowing you to examine the game state and debug your code, as shown in the next section.
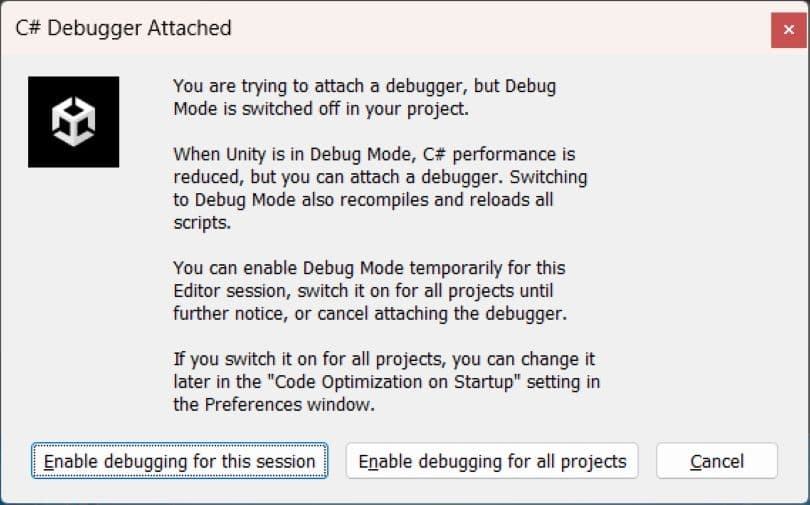
If this is your first debug session, then you’ll see a window presenting you with the option to enable debugging for the current session, or for all sessions. It’s recommended to choose the former, “Enable debugging for this session.”
Using breakpoints
A breakpoint is a marker on a specific line of code. When the debugger encounters a breakpoint, it stops executing the program, allowing you to inspect the current state of variables, objects, and the call stack. You can then step through the code line by line, observing how the state changes as the program runs.
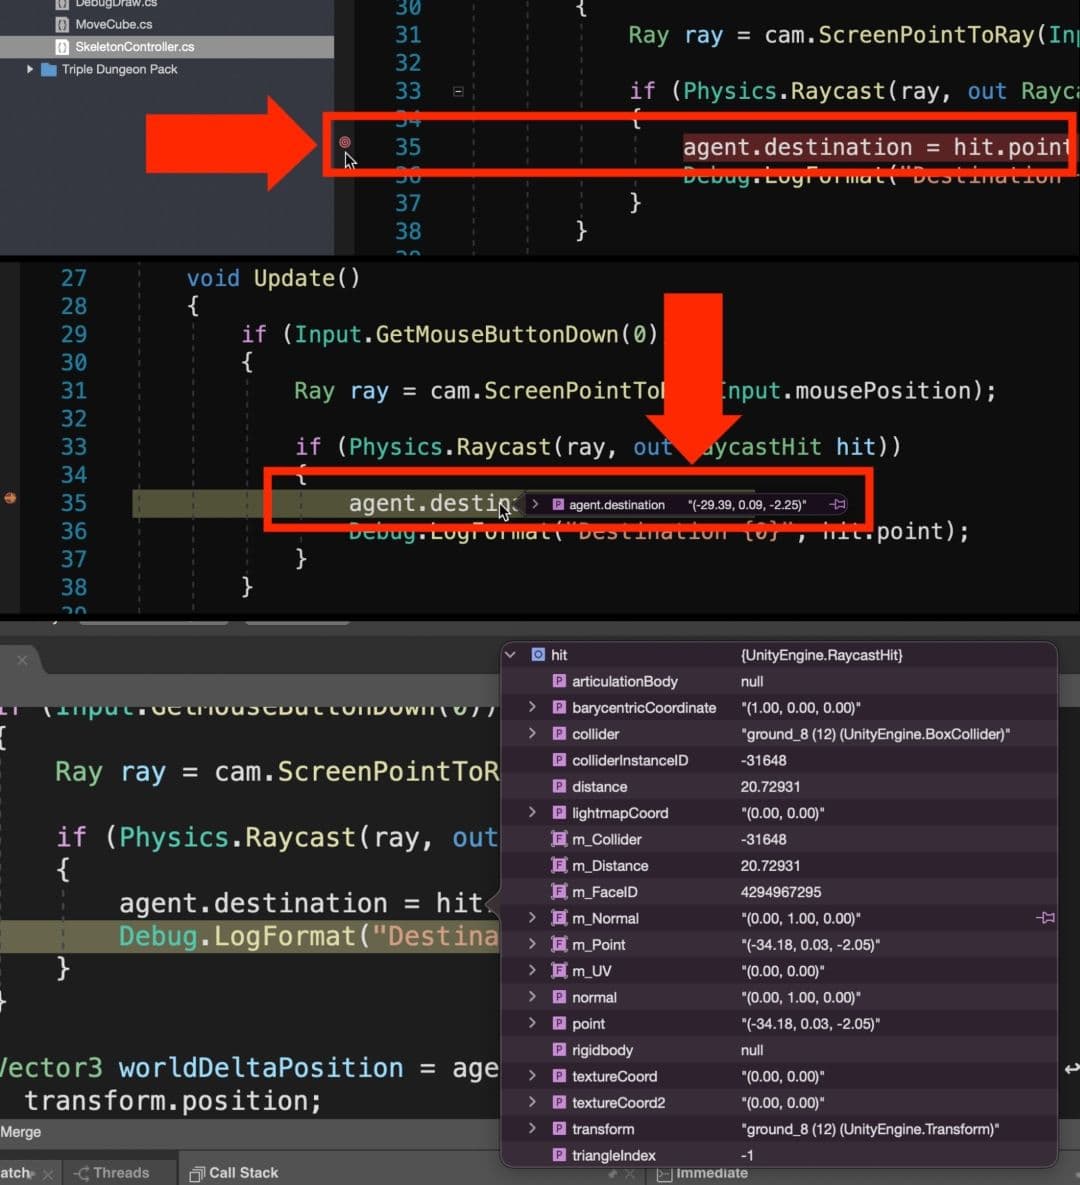
To set a breakpoint in Visual Studio, open the script and click in the left margin of the code editor next to the line of code where you want to pause execution. Or, place the cursor on the line and press F9. A red dot will appear, indicating that a breakpoint has been set, as shown in the top image above.
Now go to the Unity Editor and play the game. When program execution reaches the line with the breakpoint, Visual Studio will become the foreground active application with program execution paused at the breakpoint line. At this point, you can use Visual Studio tools to inspect variables.
The simplest option is to hover over an object, property, or simple variable. Visual Studio will add an overlay panel (bottom image in the collage above), letting you view the overloads of a function, the properties of an object, and the values of a property or variable.
If the overlay has a right-pointing arrow, then clicking this will expand the panel to offer more insight on the internal values of properties of the object.
This ability to examine values in a running program is incredibly useful.
Once Visual Studio is attached to Unity, a new toolbar is added to the right of Debug > Attach to Unity. The four buttons in this toolbar do the following, left to right:
- Continue/Pause Execution: If the program is currently playing, then a pause icon will display that you can click to pause execution. With the program paused, a right arrow icon appears, indicating that pressing will resume program execution.
- Step Over: Pressing this button will execute the highlighted code line and pause again at the next line.
- Step Into: If the active code line includes a function where the source code is part of the project, then this button allows the developer to step into and through the function and its code.
- Step Out: This moves program execution out of the current function.

Conditional breakpoints
A conditional breakpoint is an advanced form of breakpoint that only pauses execution if a specified condition is met. This can be useful when you want to investigate a specific scenario or when a problem occurs only under certain conditions.
If you right-click on the breakpoint in the sidebar or in the bottom panel breakpoint window, the context menu will be displayed. Choose Edit Breakpoint. The dialog box shown in the image above will be displayed.
More debug tools
In Visual Studio, the debugger window provides several windows that help you inspect the state of your application while it’s paused at a breakpoint. Three essential windows for examining the state of your program are Locals, Watch, and Call Stack. The following sections look at each one.
Locals
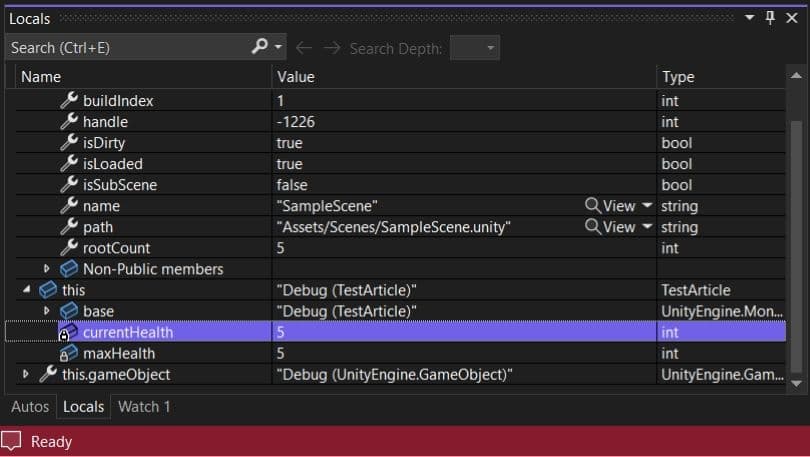
The Locals window displays the local variables and their values in the current scope of the executing code. This includes variables that are declared within the current method or block, as well as method arguments. The Locals window allows you to quickly inspect the values of variables at the current breakpoint, which can be helpful for identifying incorrect or unexpected values that may be causing issues in your code. Remember, if a line starts with a right-pointing arrow it’s expandable, while a down-facing arrow will shrink the expanded window.
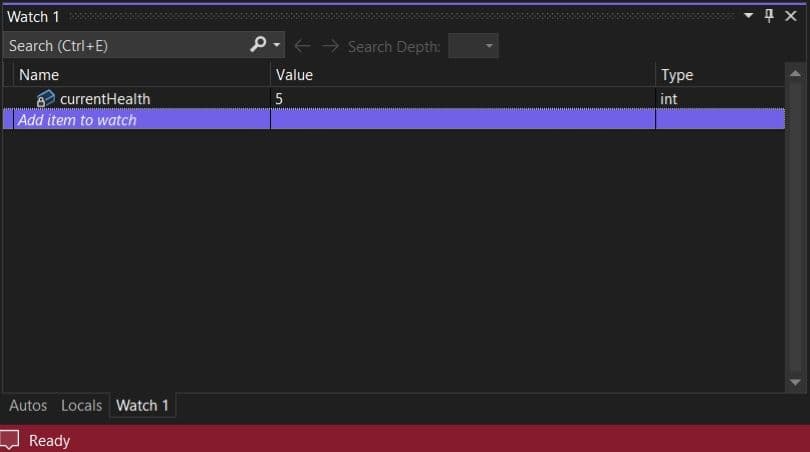
Watch
The Watch window allows you to keep track of specific variables or expressions that you want to monitor during the debugging process. Unlike the Locals window, which shows variables in the current scope, the Watch window lets you manually add variables or expressions, regardless of their scope. This can be useful for tracking the state of certain variables throughout the execution of your program or for evaluating expressions based on the current state of your application.
Enter the name of a variable or object in scope and a panel will be added to allow you to inspect it. To add a watch in Visual Studio, right-click on a variable or expression in your code and select Add Watch from the context menu, or type the expression directly into the Watch window.
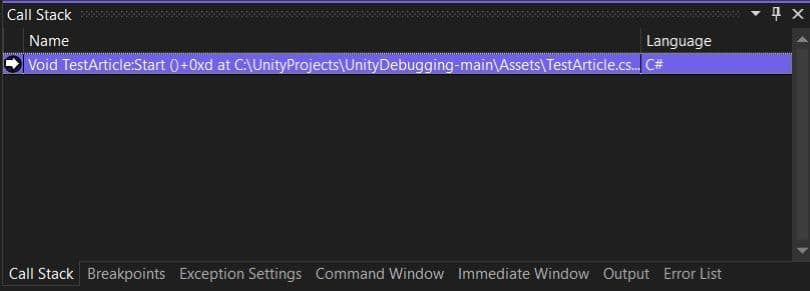
Call Stack
The Call Stack window displays the sequence of method calls that led to the current breakpoint, allowing you to trace the execution path of your program. Each entry in the call stack represents a method call, with the most recent call at the top of the list. By inspecting the call stack, you can determine how your code arrived at the current point of execution, helping you identify the root cause of issues or unexpected behavior.
In addition to showing the sequence of method calls, the Call Stack window allows you to navigate through the different levels of the stack. By double-clicking on an entry in the list, you can jump to the corresponding line of code in the source file and view the local variables and parameters for that method. This makes it easier to understand the context in which a particular method was called and analyze the flow of data through your application.
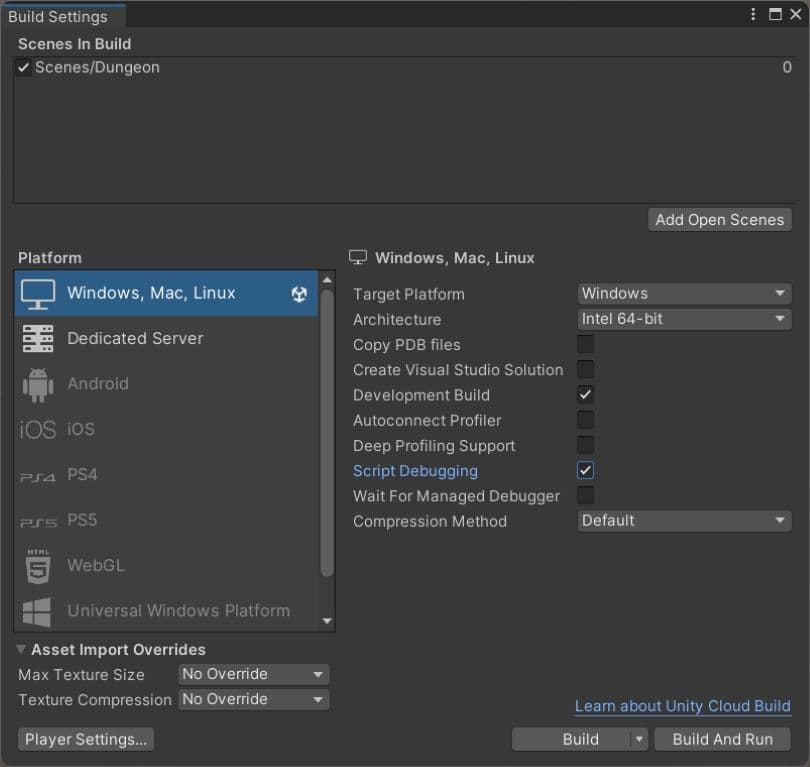
Debugging a build
The Visual Studio debugger is not just useful for the game running in the Unity Editor, but for builds as well. You’ll need to ensure that the build includes data used by the debugger. You do this via File > Build Settings,and, in the window that’s displayed, choose Development Build and Script Debugging (see image above)
Select Debug > Attach Unity Debugger from the main menu for Windows, or Debug > Attach to Process from the top menu for MacOS.
Choose the instance called Unity Player. Now all breakpoints, locals, and watches are available in the development build.

More resources for advanced Unity creators
Are you planning to use another code editor? Read our article on tips for Microsoft Visual Studio Code.
Unity provides a number of advanced guides to help professional developers optimize their game code. Create a C# style guide: Write cleaner code that scales compiles advice from industry experts on how to create a code style guide to help your team develop a clean, readable, and scalable codebase.
Another popular guide with our users is 70+ tips to increase productivity with Unity. It’s packed with time-saving tips to improve your day-to-day aggregate workflow with Unity 2020 LTS, including tips even experienced developers might have missed out on.
Find all of Unity’s advanced e-books and articles in the Unity best practices hub.