
Speed up debugging with Microsoft Visual Studio Code
Unity supports a variety of code editors, including Microsoft Visual Studio and Visual Studio Code, JetBrains Rider, and Atom.
Microsoft Visual Studio Code (VS Code) is a lightweight alternative to Visual Studio that provides a cross-platform extensible IDE, as well as a rich ecosystem of extensions that can be installed to add functionality and customize the IDE. It’s free to use as open source, making it an attractive option for developers on a budget.
Microsoft also offers a Unity extension that provides C# developers with a streamlined Unity development experience on Visual Studio Code.
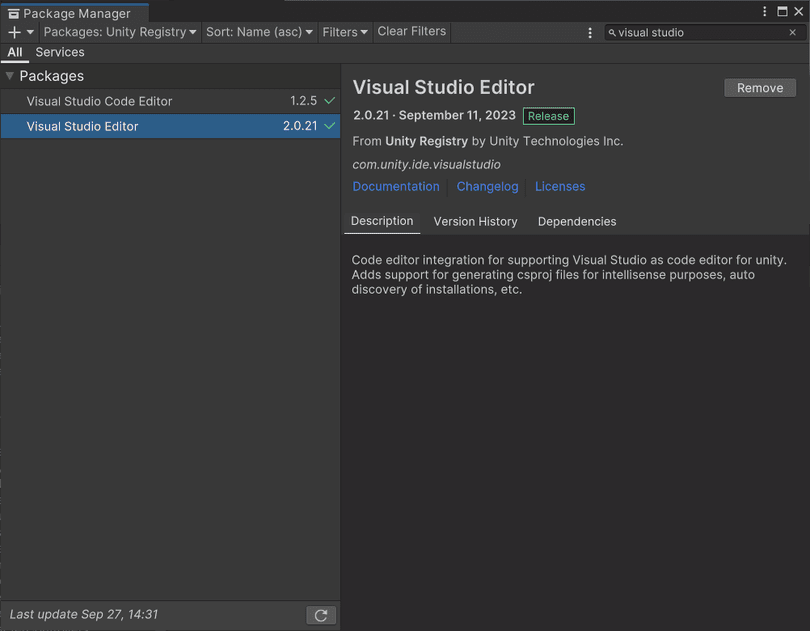
Install the Visual Studio Editor Unity Package
VS Code works with many available extensions to function as a full-scale IDE.
You’ll need to complete several steps to use VS Code in Unity.
First, download and install Visual Studio Code from the website, where you’ll find versions for Windows, macOS, and Linux.
After you install VS Code, get the Visual Studio Editor package for Unity. In the Package Manager window, be sure to install. If you have an older version of the package, upgrade to version 2.0.20 or above.
The Visual Studio Editor package now handles the entire family of Visual Studio products. Be sure not to confuse it with the package named Visual Studio Code Editor, which is no longer supported.
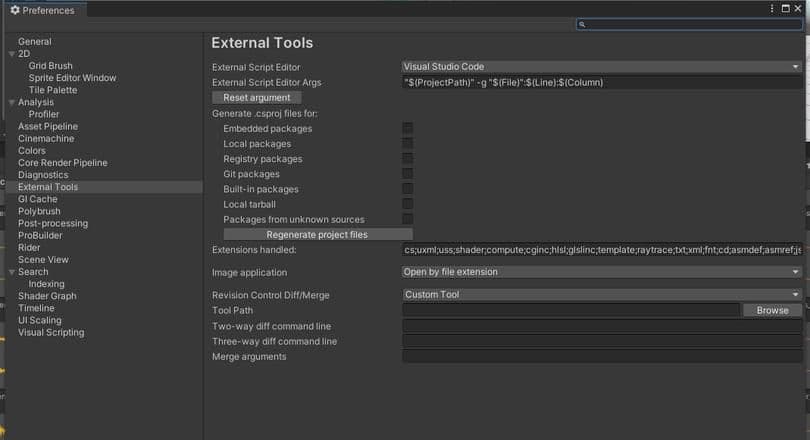
Set up VS Code for Unity
After installing VS Code and the Visual Studio Editor package, you’ll need to set VS Code as the external script editor.
Do this via Unity > Preferences > External Tools in the Editor. Under External Script Editor, choose Visual Studio Code from the drop-down menu. If VS Code doesn’t appear in the list, click Browse and locate the VS Code executable on your system. The next time you open a C# file in Unity, it will open Visual Studio Code for you.
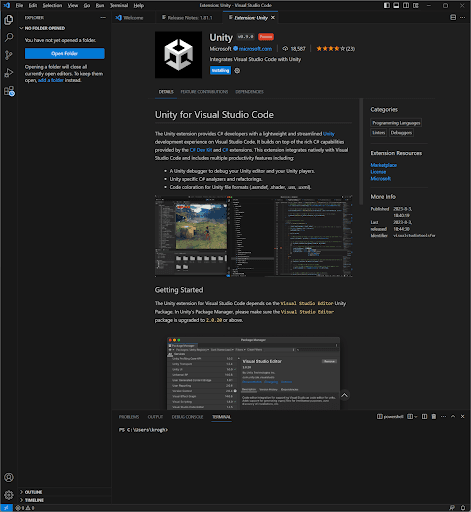
Install the VS Code extension
The next step is to install the Unity extension for Visual Studio Code, which provides a streamlined Unity development experience. It builds on top of the rich capabilities provided by the C# Dev Kit and C# extensions, and integrates natively with Visual Studio Code.
Key features include:
- A debugger for your Unity Editor and players
- Unity-specific C# analyzers and refactorings
- Code coloration for Unity file formats (.asmdef, .shader, .uss, .uxml)
Go to the Visual Studio Marketplace to get the extension. After you download it, a window will prompt you to open it in the Visual Studio Code application. VS Code will then install the Unity extensions, including C# Dev Kit and C# extensions.
Once installed, you can set up the C# Dev Kit environment.
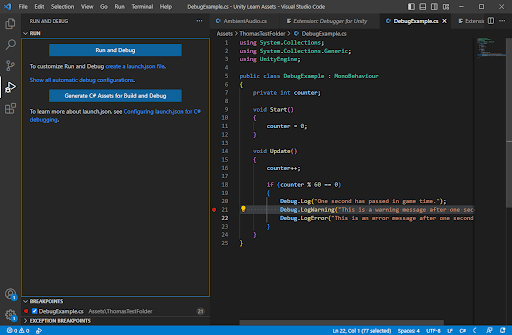
Debugging using VS Code
There is a Play button in the left toolbar of the VS Code editor that’s marked with a bug icon. By clicking this, you’ll open the Run and Debug view. At the top of that view is a Play button and a drop-down list of launch options from the launch.json file. Select Unity Editor (it should already be selected by default since it’s the first launch option).
The Run and Debug view includes five windows for examining the state of your program: Locals, Watch, Call Stack, Breakpoints, and Exception Breakpoints (this last option is usually not used as frequently as the other four). These windows help you to inspect your code and understand the current state of your application while you are debugging. They work in a similar way to debugging windows in Visual Studio.
Add breakpoints by clicking in the margin or pressing F9 when the breakpoint line is selected in the code you want to test. Breakpoints in the editor margin will be shown as solid red circles.
Breakpoints can be edited by right-clicking, and conditions can be added to control the program breaking. When program execution is paused in VS Code, a toolbar is added to the view (similar to Visual Studio). The toolbar provides the following buttons:
- Play/Pause (F6)
- Step Over (F10)
- Step Into (F11)
- Step Out (⇧F11)
- Restart: Ctrl⇧F5 (Windows) and ⇧⌘F5 (macOS)
- Stop Debugging (⇧F5)
Learn more about the VS Code toolbar feature in the VS Code documentation, and see this video for more tips.
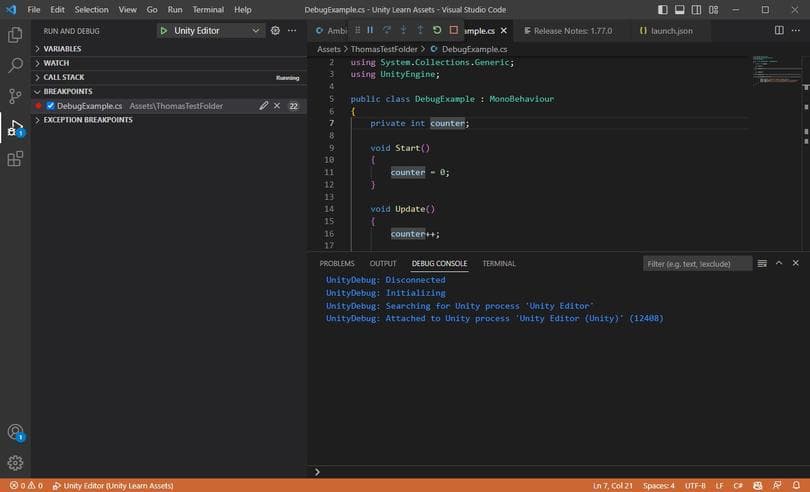
Leveraging the debugging windows
Local
The Local window displays the values of all local variables in the current scope where the execution is paused. This includes variables declared within the method or function you are currently debugging, allowing you to use it to inspect the values of variables at the current point in your code execution.
Watch
The Watch window allows you to add specific variables or expressions that you want to monitor during the debugging process by manually adding any variable or expression to the Watch. You can see values being updated as you step through the code, a useful feature when you want to keep track of specific variables or expressions throughout the debugging session, even if they are not in the current scope.
Call Stack
The Call Stack window is useful for understanding the flow of your code and identifying how a particular piece of code was reached. It shows the sequence of method or function calls that led to the current point of execution, with each entry in the call stack representing a method or function call and the most recent call at the top. You can click on any entry in the call stack to navigate to the corresponding code in your project and view the local variables at that point in the execution.
Breakpoint
The Breakpoint window shows a list of all breakpoints you have set in your code. Breakpoints are the markers that you place in your code to pause execution when a particular line is reached. You can use this window to enable or disable breakpoints, remove them, or navigate to the corresponding line of code in your project. This is useful for managing your breakpoints (if you have many) and for quickly jumping to specific locations in your code where you want to pause execution.

More resources for advanced Unity creators
Are you planning to use another code editor? You can read our article on Microsoft Visual Studio 2022.
Help boost team productivity with our e-book Create a C# style guide: Write cleaner code that scales. Get advice from industry experts on how to create a code style guide to help your team develop a clean, readable, and scalable codebase.
You’ll find many more productivity tips in 70+ tips to increase productivity with Unity. Improve your day-to-day aggregate workflow with Unity 2020 LTS, including tips even experienced developers might have missed out on.
Find all of Unity’s advanced e-books and articles in the Unity best practices hub.