
Get the information you need to make your game shine. By keeping an eye on your game’s performance profile, you can make sure that the player experience you’ve crafted isn’t tarnished by performance issues. Optimizing your game also helps you target a wider range of platforms and devices.
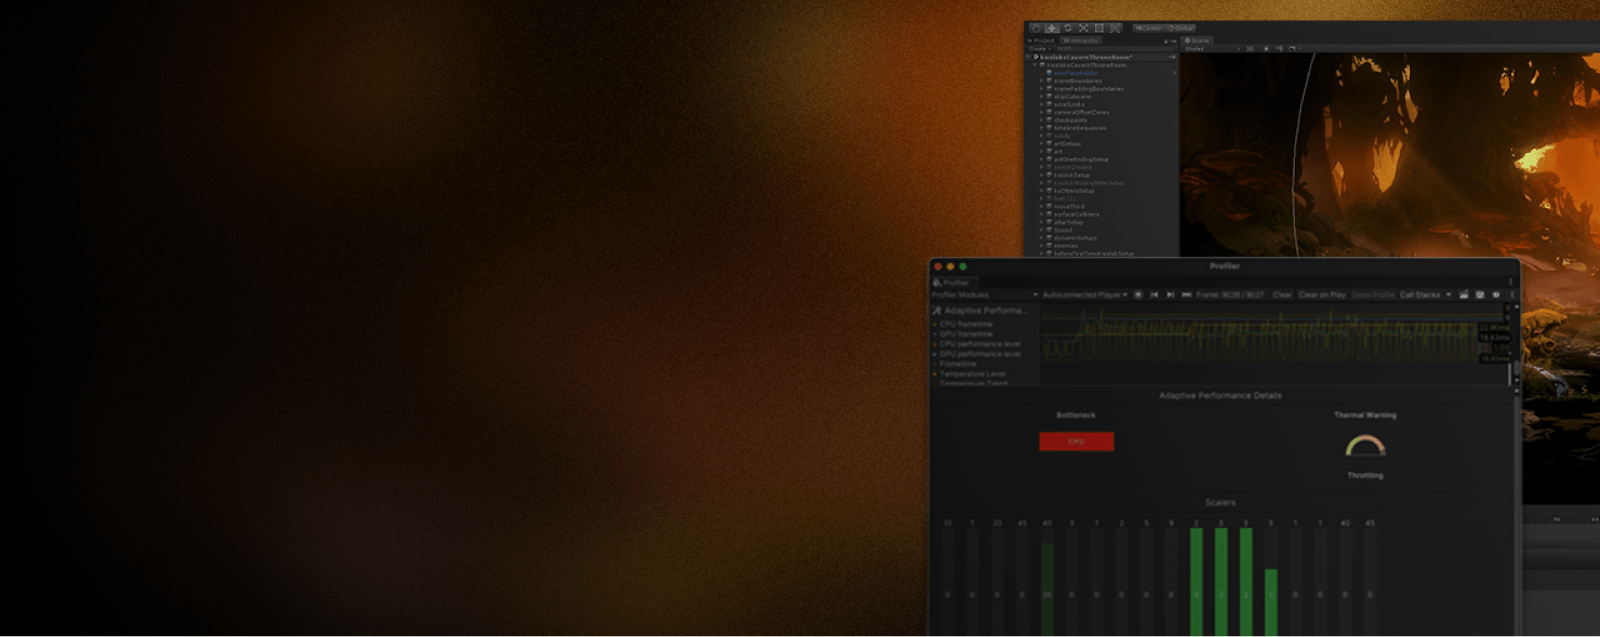
Unity 6 includes the Highlights Profiler module, which helps you find the best place to focus when optimizing. We’ve also released an improved Memory Profiler that allows for more accurate resident memory usage and provides a detailed breakdown of graphics memory for quicker, higher impact optimizations for your project.
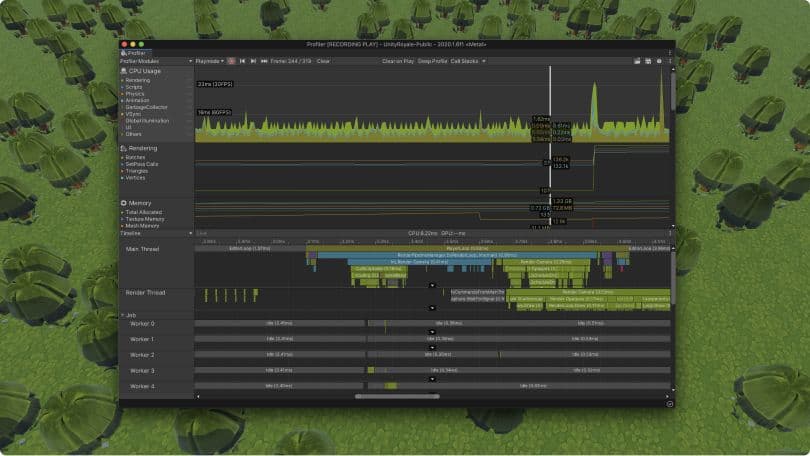
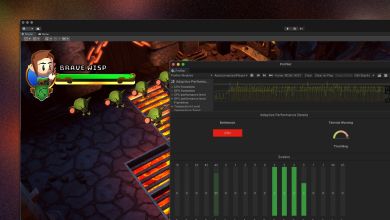
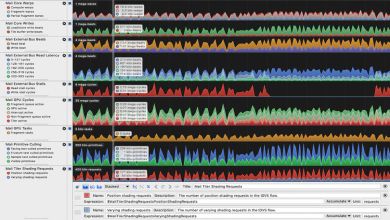
The Unity Profiler gathers and displays performance data in a series of charts. This visualization helps you focus your optimization work on the most resource-demanding areas, whether that’s code, audio, physics, animation, or rendering. You can connect it to devices on your network or plugged into your machine to test how your application runs on the target platform.
Unity Profiler is part of the Unity Editor, and it comes with a low-level native plug-in Profiler API so you can customize your analysis and export profiling data to other tools. See the impact of your changes between a set of Unity Profiler frames with the Profile Analyzer package.
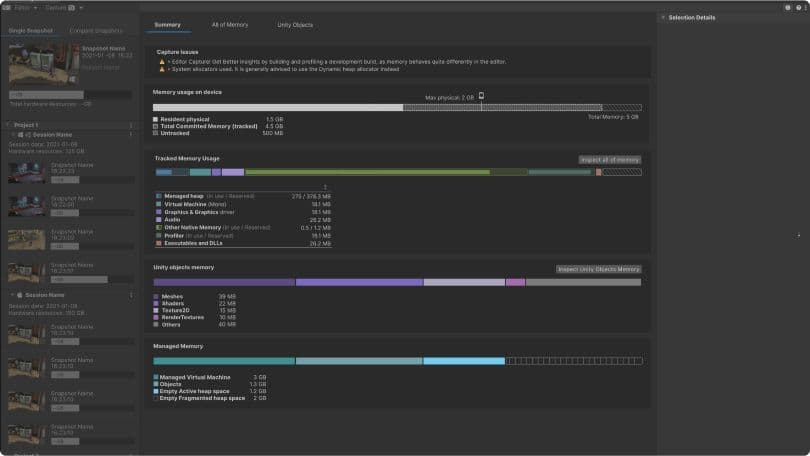
Memory profiling is useful for testing against target hardware memory limitations. It’s also a great tool if you want to improve CPU/GPU performance of your Unity game by making changes that actually increase memory usage. The Memory Profiler is a package that adds a window to the Unity Editor, so you can see memory usage in your application in even greater detail. You can store and compare snapshots to find memory leaks, or see the memory layout to find memory fragmentation issues.
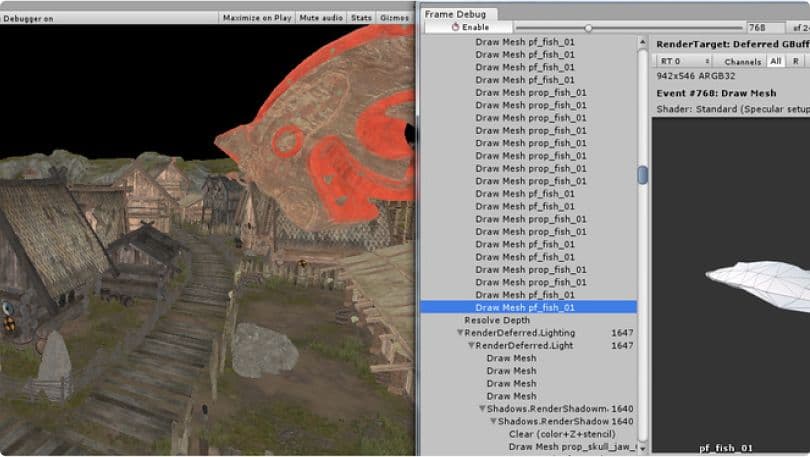
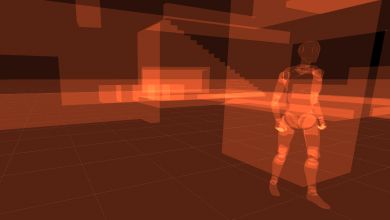
The Frame Debugger lets you freeze playback for a running game on a particular frame, then view the individual draw calls used to render that frame. You can go through the rendering steps one at a time to see how the scene is constructed from its graphical elements. This enables you to quickly spot what needs fixing or investigate optimization opportunities.
We built this 70+ page guide with industry experts. It shows you how to profile an application in Unity, manage its memory, and optimize its power consumption from start to finish.

Profiling is one of the best ways to optimize your game. Learn how to use Unity’s highly effective profiling tools and how to interpret the data they produce.

Learn how to find expensive function calls in Timeline and how to master the Profile Analyzer to identify and diagnose slow frames. Find out how to optimize memory and capture and analyze allocations, assets, and duplicates with the Memory Profiler.

This tutorial covers how to profile your game effectively using the Unity Profiler and how to spot performance bottlenecks.

Learn how to use the Profile Analyzer alongside the Unity Profiler to monitor performance and analyze data across a range of frames.

Explore the Memory Profiler and learn how to capture, read, and compare memory management snapshots.

Adaptive Performance ships with samples to help you integrate all package functionality into your project.
This blog post in our Games Focus series covers the status, upcoming release plans, and future vision for profiling and performance tools and features.

Our engineers work with top mobile studios to improve player experience. This free e-book collects 75+ of their in-depth tips to help you up your game.
Extending the Unity Profiler with your own performance metrics enables you to better understand your application’s unique performance story.

Browse the Unity Manual for in-depth information on how memory in Unity works and how to use the Unity Profiler and other tools.
Get more details on when to use the specific profiling features, including an overview of GPU debugging tools and native tools from companies such as Arm, AMD, or Superluminal.

This page outlines a recommended general profiling workflow for game developers and includes recommendations for metrics to focus on.

This quick, step-by-step overview helps you get started analyzing memory usage in your Unity application.

We offer training for professionals in a variety of formats designed to fit into your schedule.