
Performance profiling tips for game developers
Smooth performance is essential to creating immersive gaming experiences for players. To ensure your game is optimized, a consistent, end-to-end profiling workflow, is a “must have” for efficient game development, and it starts with a simple three-point procedure:
- Profile before making major changes: Establish a baseline.
- Profiling during development: Track and ensure changes don’t break performance or budgets.
- Profile after: Prove the changes had the desired effect.
This page outlines a general profiling workflow for game developers. It’s excerpted from the e-book, Ultimate guide to profiling Unity games, available to download for free (the Unity 6 version of the guide will be available soon). The e-book was created by both external and internal Unity experts in game development, profiling, and optimization.
In this article you can learn about useful goals to set with profiling, common performance bottlenecks, such as being CPU-bound or GPU-bound, and how to identify and investigate these situations in more detail.
Set a frame budget
Gamers often measure performance using frame rate, or frames per second (fps), but as a developer, it’s generally recommended to use frame time in milliseconds instead. Consider the following simplified scenario:
During runtime, your game renders 59 frames in 0.75 seconds. However, the next frame takes 0.25 seconds to render. The average delivered frame rate of 60 fps sounds good, but in reality players will notice a stutter effect since the last frame takes a quarter of a second to render.
This is one of the reasons why it’s important to aim for a specific time budget per frame. This provides you with a solid goal to work toward when profiling and optimizing your game, and ultimately, it creates a smoother and more consistent experience for your players.
Each frame will have a time budget based on your target fps. An application targeting 30 fps should always take less than 33.33 ms per frame (1000 ms / 30 fps). Likewise, a target of 60 fps leaves 16.66 ms per frame (1000 ms / 60 fps).
You can exceed this budget during non-interactive sequences, for example, when displaying UI menus or scene loading, but not during gameplay. Even a single frame that exceeds the target frame budget will cause hitches.
Note: A consistently high frame rate in VR games is essential to avoid causing nausea or discomfort to players, and is often necessary for your game to get certification from the platform holder.
Frames per second: A deceptive metric
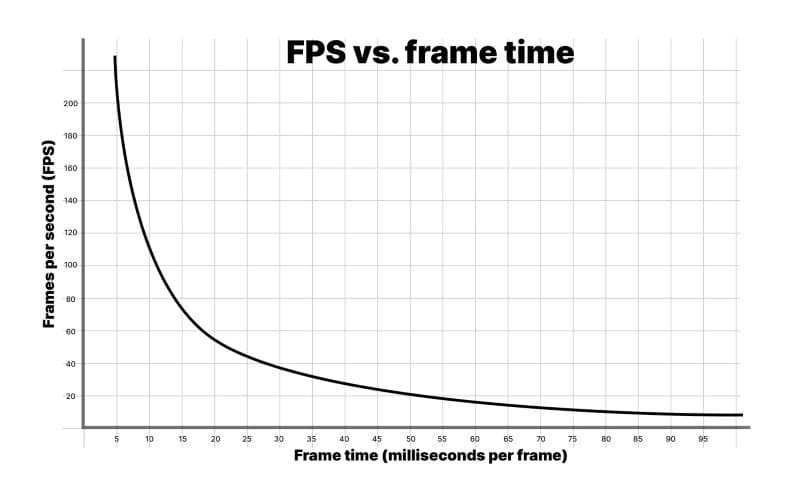
A common way that gamers measure performance is with frame rate, or frames per second. However, it’s recommended that you use frame time in milliseconds instead. To understand why, look at the above graph of fps versus frame time.
Consider these numbers:
1000 ms/sec / 900 fps = 1.111 ms per frame
1000 ms/sec / 450 fps = 2.222 ms per frame
1000 ms/sec / 60 fps = 16.666 ms per frame
1000 ms/sec / 56.25 fps = 17.777 ms per frame
If your application is running at 900 fps, this translates into a frame time of 1.111 milliseconds per frame. At 450 fps, this is 2.222 milliseconds per frame. This represents a difference of only 1.111 milliseconds per frame, even though the frame rate appears to drop by one half.
If you look at the differences between 60 fps and 56.25 fps, that translates into 16.666 milliseconds per frame and 17.777 milliseconds per frame, respectively. This also represents 1.111 milliseconds extra per frame, but here, the drop in frame rate feels far less dramatic percentage-wise.
This is why developers use the average frame time to benchmark game speed rather than fps.
Don’t worry about fps unless you drop below your target frame rate. Focus on frame time to measure how fast your game is running, then stay within your frame budget.
Read the original article, “Robert Dunlop’s fps versus frame time,” for more information.
Mobile challenges
Thermal control is one of the most important areas to optimize for when developing applications for mobile devices. If the CPU or GPU spend too long working at full throttle due to inefficient code, those chips will get hot. To avoid overheating and potential damage to the chips the operating system will reduce the clock speed of the device to allow it to cool down, causing frame stuttering and a poor user experience. This performance reduction is known as thermal throttling.
Higher frame rates and increased code execution (or DRAM access operations) lead to increased battery drain and heat generation. Bad performance can also make your game unplayable for entire segments of lower-end mobile devices, which can lead to missed market opportunities.
When taking on the problem of thermals, consider the budget you have to work with as a system-wide budget.
Combat thermal throttling and battery drain by profiling early to optimize your game from the start. Dial in your project settings for your target platform hardware to combat thermal and battery drain problems.
Adjust frame budgets on mobile
A general tip to combat device thermal issues over extended play times is to leave a frame idle time of around 35%. This gives mobile chips time to cool down and helps to prevent excessive battery drain. Using a target frame time of 33.33 ms per frame (for 30 fps), the frame budget for mobile devices will be approximately 22 ms per frame.
The calculation looks like this: (1000 ms / 30) * 0.65 = 21.66 ms
To achieve 60 fps on mobile using the same calculation would require a target frame time of (1000 ms / 60) * 0.65 = 10.83 ms. This is difficult to achieve on many mobile devices and would drain the battery twice as fast as targeting 30 fps. For these reasons, many mobile games target 30 fps rather than 60. Use Application.targetFrameRate to control this setting, and refer to the "Set a frame budget" section in the profiling e-book for more details about frame time.
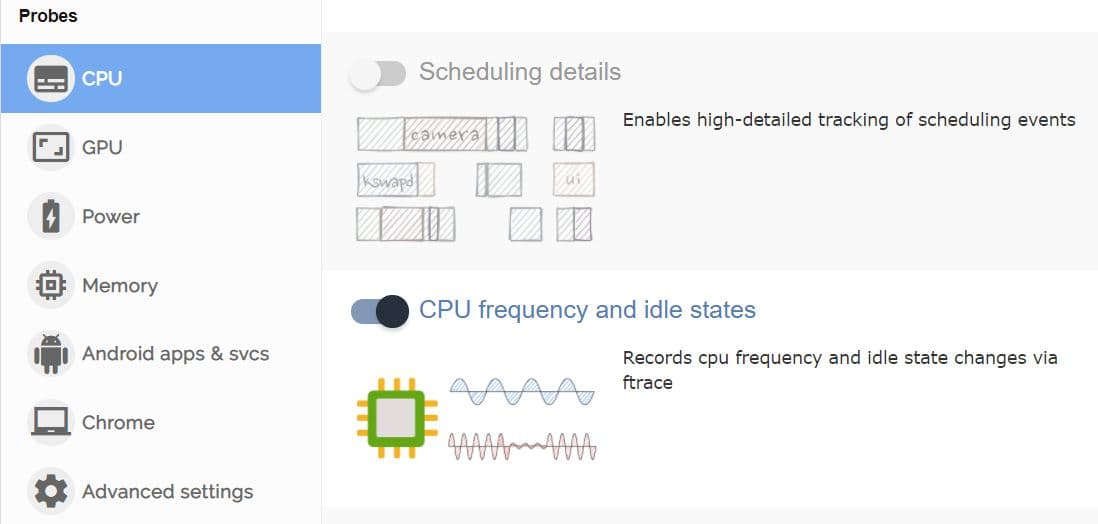
Frequency scaling on mobile chips can make it tricky to identify your frame idle time budget allocations when profiling. Your improvements and optimizations can have a net positive effect, but the mobile device might be scaling frequency down, and as a result, running cooler. Use custom tooling such as FTrace or Perfetto to monitor mobile chip frequencies, idle time, and scaling before and after optimizations.
As long as you stay within your total frame time budget for your target fps (say 33.33 ms for 30 fps) and see your device working less or logging lower temperatures to maintain this frame rate, then you’re on the right track.
Another reason to add breathing room to frame budget on mobile devices is to account for real-world temperature fluctuations. On a hot day, a mobile device will heat up and have trouble dissipating heat, which can lead to thermal throttling and poor game performance. Set aside a percent of the frame budget to help avoid this scenario.
Reduce memory access operations
DRAM access is typically a power-hungry operation on mobile devices. Arm’s optimization advice for graphics content on mobile devices says that LPDDR4 memory access costs approximately 100 picojoules per byte.
Reduce the number of memory access operations per frame by:
- Reducing frame rate
- Reducing display resolution where possible
- Using simpler meshes with reduced vertex count and attribute precision
- Using texture compression and mipmapping
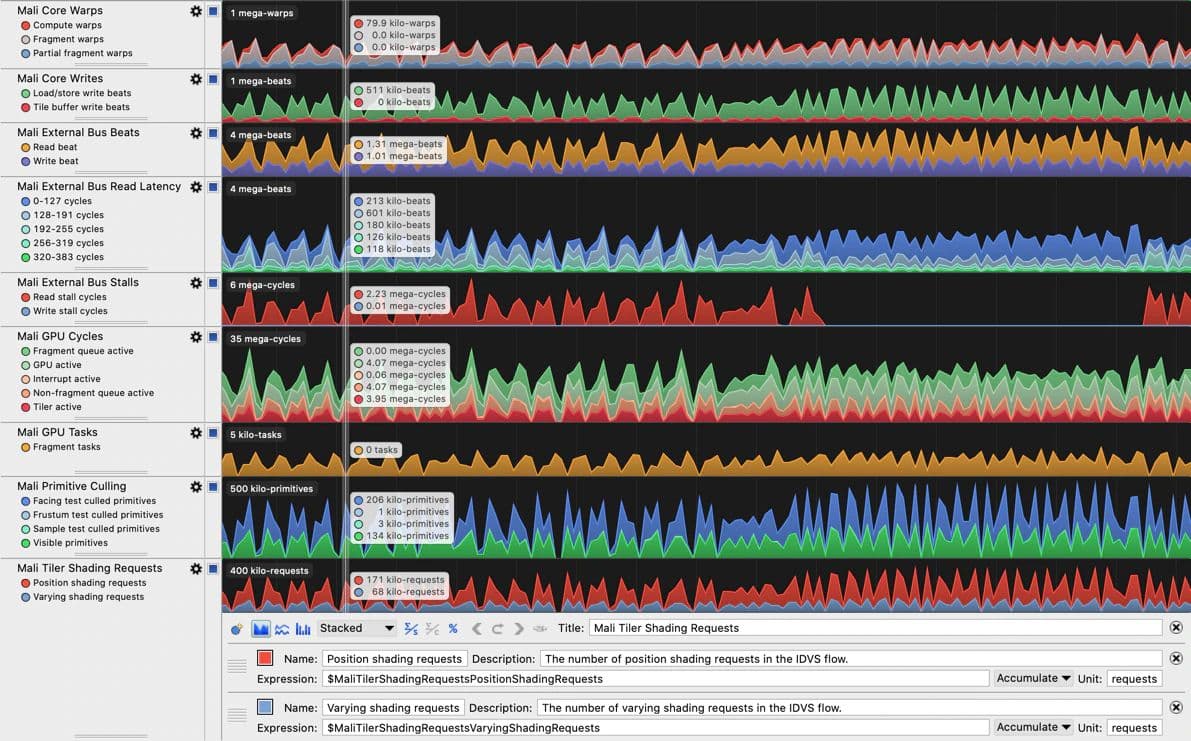
When you need to focus on devices leveraging Arm CPU or GPU hardware, Arm Performance Studio tooling (specifically, Streamline Performance Analyzer) includes some great performance counters for identifying memory bandwidth issues. The available counters are listed and explained for each Arm GPU generation in a corresponding user guide, for example, Mali-G710 Performance Counter Reference Guide . Note that Arm Performance Studio GPU profiling requires an Arm Immortalis or Mali GPU.
Establish hardware tiers for benchmarking
In addition to using platform-specific profiling tools, establish tiers or a lowest-spec device for each platform and tier of quality you wish to support, then profile and optimize performance for each of these specifications.
As an example, if you’re targeting mobile platforms, you might decide to support three tiers with quality controls that toggle features on or off based on the target hardware. You then optimize for the lowest device specification in each tier. As another example, if you’re developing a game for consoles make sure you profile on both older and newer versions.
Our latest mobile optimization guide has many tips and tricks that will help you reduce thermal throttling and increase battery life for mobile devices running your games.
From high- to low-level profiling
When profiling, you want to ensure you focus your time and effort on areas where you can create the biggest impact. Thus it's recommended to start with a top-to-bottom approach when profiling, meaning you begin with a high-level overview of categories such as rendering, scripts, physics, and garbage collection (GC) allocations. Once you’ve identified areas of concern you can drill down into the deeper details. Use this high-level pass to collect data and take notes on the most critical performance issues, including scenarios that cause unwanted managed allocations or excessive CPU usage in your core game loop.
You’ll need to first gather call stacks for GC.Alloc markers. If you’re unfamiliar with this process, find some tips and tricks in the section titled "Locating recurring memory allocations over application lifetime" in the e-book.
If the reported call stacks are not detailed enough to track down the source of the allocations or other slowdowns, you can perform a second profiling session with Deep Profiling enabled in order to find the source of the allocations. We cover deep profiling in more detail in the e-book but in summary, it’s a mode in the Profiler that captures detailed performance data for every function call, providing granular insights into execution times and behaviors, but with significantly higher overhead compared to standard profiling.
When collecting notes on the frame time “offenders,” be sure to note how they compare relative to the rest of the frame. This relative impact can be distorted when deep profiling is enabled, because deep profiling adds significant overhead by instrumenting every method call.
Profile early
While you should always profile throughout the entire development cycle of your project, the most significant gains from profiling are made when you start in the early phases.
Profile early and often so you and your team understand and memorize a “performance signature” for the project you can use to benchmark against. If performance takes a nosedive, you’ll be able to easily spot when things go wrong and fix the issue.
While profiling in the Editor gives you an easy way to identify the main issues, the most accurate profiling results always come from running and profiling builds on target devices, together with leveraging platform-specific tooling to dig into the hardware characteristics of each platform. This combination will provide you with a holistic view of application performance across all your target devices. For example, you might be GPU-bound on some mobile devices but CPU-bound on others, and you can only learn this by measuring on those devices.
Identify performance issues
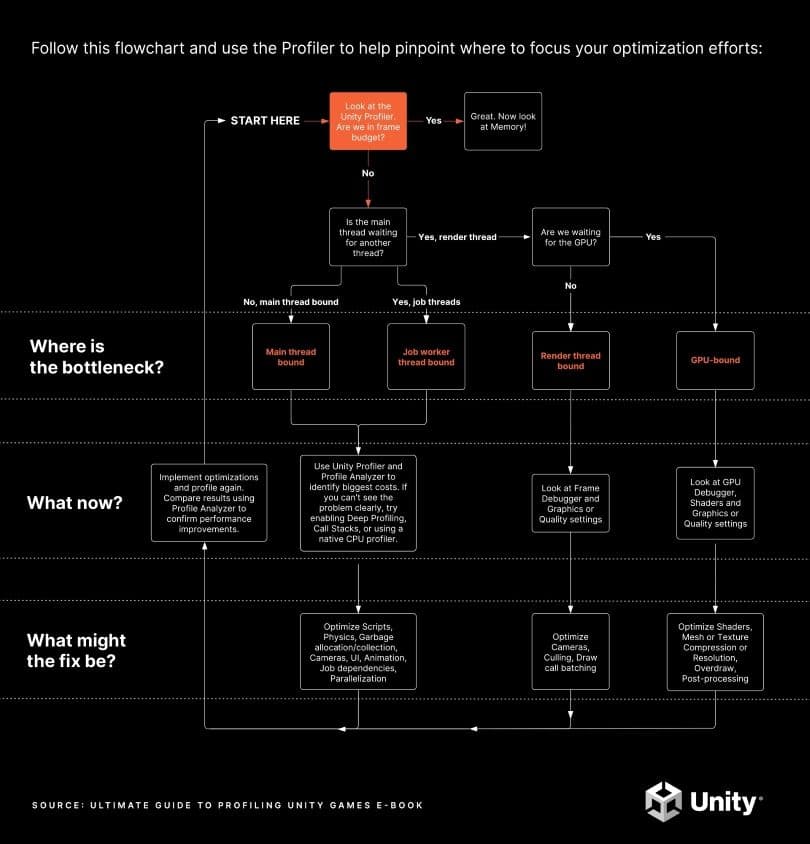
Download the printable PDF version of this chart here.
The point of profiling is to identify bottlenecks as targets for optimization. If you rely on guesswork, you can end up optimizing parts of the game that are not bottlenecks, resulting in little or no improvement to overall performance. Some “optimizations” might even worsen your game’s overall performance while other ones can be labor-intensive but yield insignificant results. The key is to optimize the impact of your focused time investment.
The flow chart above illustrates the initial profiling process with the sections following it providing detailed information on each step. They also present Profiler captures from real Unity projects to illustrate the kinds of things to look for.
To get a holistic picture of all CPU activity, including when it’s waiting for the GPU, use the Timeline view in the CPU module of the Profiler. Familiarize yourself with the common Profiler markers to interpret captures correctly. Some of the Profiler markers may appear differently depending on your target platform, so spend time exploring captures of your game on each of your target platforms to get a feel for what a “normal” capture looks like for your project.
A project’s performance is bound by the chip and/or thread that takes the longest. That’s the area on where optimization efforts should focus. For example, imagine the following scenarios for a game with a target frame time budget of 33.33 ms and VSync enabled:
- If the CPU frame time (excluding VSync) is 25 ms and GPU time is 20 ms, no problem! You’re CPU-bound, but everything is within budget, and optimizing things won’t improve the frame rate (unless you get both CPU and GPU below 16.66 ms and jump up to 60 fps).
- If the CPU frame time is 40 ms and GPU is 20 ms, you’re CPU-bound and will need to optimize the CPU performance. Optimizing the GPU performance won’t help; in fact, you might want to move some of the CPU work onto the GPU, for example, by using compute shaders instead of C# code where applicable, to balance things out.
- If the CPU frame time is 20 ms and GPU is 40 ms, you’re GPU-bound and need to optimize the GPU work.
- If CPU and GPU are both at 40 ms, you’re bound by both and will need to optimize both below 33.33 ms to reach 30 fps.
See these resources that further explore being CPU- or GPU-bound:
Are you within frame budget?
Profiling and optimizing your project early and often throughout development will help you ensure that all of your application’s CPU threads and the overall GPU frame time are within the frame budget. The question which will guide this process is, are you within the frame budget or not?
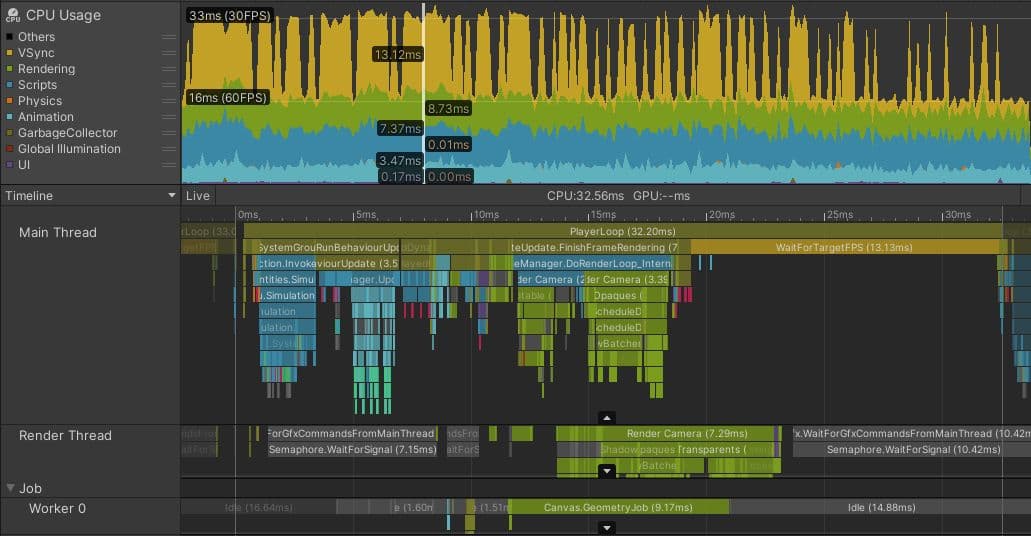
Above is an image of a profile capture from a Unity mobile game developed by a team that did ongoing profiling and optimization. The game targets 60 fps on high-spec mobile phones, and 30 fps on medium/low-spec phones, such as the one in this capture.
Note how nearly half of the time on the selected frame is occupied by the yellow WaitForTargetFPS Profiler marker. The application has set Application.targetFrameRate to 30 fps, and VSync is enabled. The actual processing work on the main thread finishes at around the 19 ms mark, and the rest of the time is spent waiting for the remainder of the 33.33 ms to elapse before beginning the next frame. Although this time is represented with a Profiler marker, the main CPU thread is essentially idle during this time, allowing the CPU to cool and use a minimum of battery power.
The marker to look out for might be different on other platforms or if VSync is disabled. The important thing is to check whether the main thread is running within your frame budget or exactly on your frame budget with some kind of marker that indicates that the application is waiting for VSync and whether the other threads have any idle time.
Idle time is represented by gray or yellow Profiler markers. The screenshot above shows that the render thread is idling in Gfx.WaitForGfxCommandsFromMainThread, which indicates times when it has finished sending draw calls to the GPU on one frame, and is waiting for more draw call requests from the CPU on the next. Similarly, although the Job Worker 0 thread spends some time in Canvas.GeometryJob, most of the time it’s idle. These are all signs of an application that’s comfortably within the frame budget.
If your game is in frame budget
If you are within the frame budget, including any adjustments made to the budget to account for battery usage and thermal throttling, you’re finished with the key profiling tasks. You can conclude by running the Memory Profiler to ensure that the application is also within its memory budget.
The image above shows a game running comfortably within the ~22 ms frame budget required for 30 fps. Note the WaitForTargetfps padding the main thread time until VSync and the gray idle times in the render thread and worker thread. Also note that the VBlank interval can be observed by looking at the end times of Gfx.Present frame over frame, and that you can draw up a time scale in the Timeline area or on the Time ruler up top to measure from one of these to the next.
CPU-bound
If your game is not within the CPU frame budget, the next step is to investigate what part of the CPU is the bottleneck – in other words, which thread is the most busy.
It’s rare for the entire CPU workload to be the bottleneck. Modern CPUs have a number of different cores, capable of performing work independently and simultaneously. Different threads can run on each CPU core. A full Unity application uses a range of threads for different purposes, but those that are the most common for finding performance issues are:
- The main thread: This is where the majority of the game logic/scripts perform their work by default. Most Unity systems, such as physics, animation, UI, and the initial stages of rendering, execute here.
- The render thread: This handles the preparation work (e.g., which objects in the scene are visible to the camera and which are excluded/invisible because they’re outside the view frustum, occluded, or culled by other criteria) that must happen before sending rendering instructions to the GPU.
- During the rendering process, the main thread examines the scene and performs camera culling, depth sorting, and draw call batching, resulting in a list of things to render. This list is passed to the render thread, which translates it from Unity’s internal platform-agnostic representation to the specific graphics API calls required to instruct the GPU on a particular platform.
- The Job worker threads: Developers can make use of the job system to schedule certain kinds of work to run on worker threads, which reduces the workload on the main thread. Some of Unity’s systems and features also make use of the job system, such as physics, animation, and rendering.
A real-world example of main thread optimization
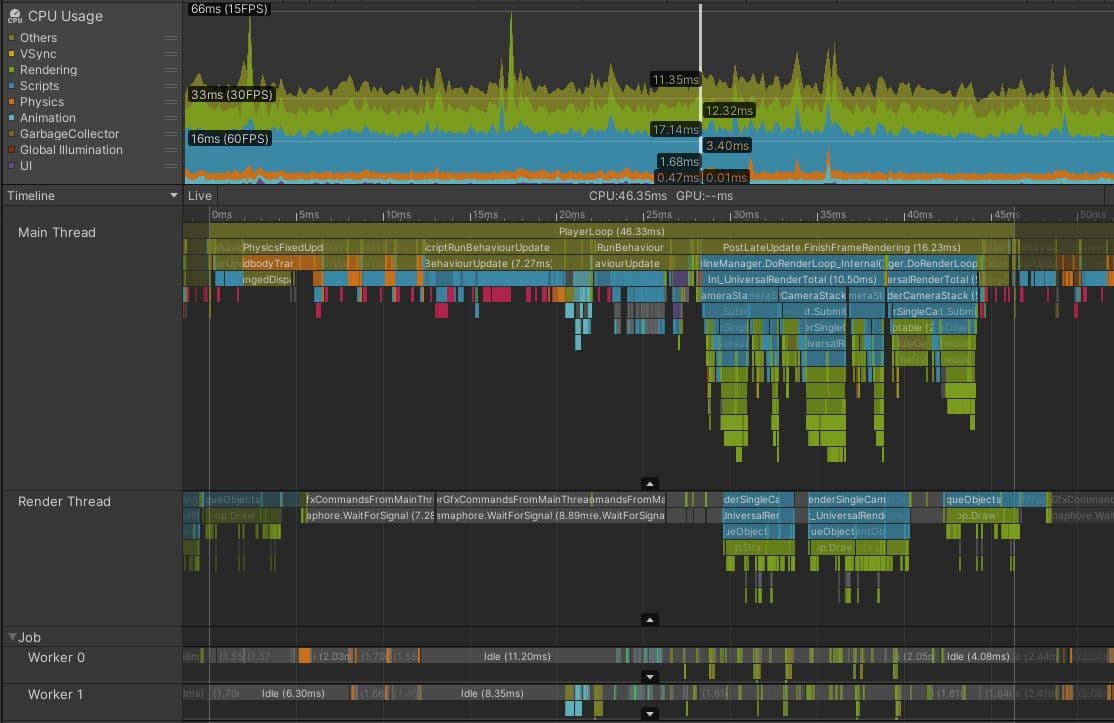
The image below shows how things might look in a project that is bound by the main thread. This project is running on a Meta Quest 2, which normally targets frame budgets of 13.88 ms (72 fps) or even 8.33 ms (120 fps), because high frame rates are important to avoid motion sickness in VR devices. However, even if this game was targeting 30 fps, it’s clear that this project is in trouble.
Although the render thread and worker threads look similar to the example which is within frame budget, the main thread is clearly busy with work during the whole frame. Even accounting for the small amount of profiler overhead at the end of the frame, the main thread is busy for over 45 ms, meaning that this project achieves frame rates of less than 22 fps. There is no marker that shows the main thread idly waiting for VSync; it’s busy for the whole frame.
The next stage of investigation is to identify the parts of the frame that take the longest time and to understand why this is so. On this frame, PostLateUpdate.FinishFrameRendering takes 16.23 ms, more than the entire frame budget. Closer inspection reveals there are five instances of a marker called Inl_RenderCameraStack, indicating that five cameras are active and rendering the scene. Since every camera in Unity invokes the whole render pipeline, including culling, sorting, and batching, the highest-priority task for this project is reducing the number of active cameras, ideally to just one.
BehaviourUpdate, the Profiler marker that encompasses all MonoBehaviour.Update() method executions, takes 7.27 milliseconds in this frame.
In the Timeline view, magenta-colored sections indicate points where scripts are allocating managed heap memory. Switching to the Hierarchy view, and filtering by typing GC.Alloc in the search bar, shows that allocating this memory takes about 0.33 ms in this frame. However, that is an inaccurate measurement of the impact the memory allocations have on your CPU performance.
GC.Alloc markers are not timed by recording a Begin and End point like typical Profiler samples. To minimize their overhead, Unity records only the timestamp of the allocation and the allocated size.
The Profiler assigns a small, artificial sample duration to GC.Alloc markers solely to ensure they are visible in the Profiler views.The actual allocation can take longer, especially if a new range of memory needs to be requested from the system. To see the impact more clearly, place Profiler markers around the code that does the allocation; in deep profiling, the gaps between the magenta-colored GC.Alloc samples in the Timeline view provide some indication of how long they might have taken.
Additionally, allocating new memory can have negative effects on performance that are harder to measure and attribute to them directly:
- Requesting new memory from the system might affect the power budget on a mobile device, which can lead to the system slowing down the CPU or GPU.
- The new memory likely needs to get loaded into the CPU’s L1 Cache and thereby pushes out existing Cache lines.
- Incremental or synchronous garbage collection may be triggered directly or with a delay as the existing free space in Managed Memory is eventually exceeded.
At the start of the frame, four instances of Physics.FixedUpdate add up to 4.57 ms. Later on, LateBehaviourUpdate (calls to MonoBehaviour.LateUpdate()) take 4 ms, and Animators account for about 1 ms. To ensure this project hits its desired frame budget and rate, all of these main thread issues need to be investigated to find suitable optimizations.
Common pitfalls for main thread bottleneck
The biggest performance gains will be made by optimizing the things that take the longest time. The following areas are often fruitful places to look for optimizing in projects that are main thread-bound:
- Physics calculations
- MonoBehaviour script updates
- Garbage allocation and/or collection
- Camera culling and rendering on the main thread
- Inefficient draw call batching
- UI updates, layouts, and rebuilds
- Animation
Read our optimization guides that offer a long list of actionable tips for optimizing some of the most common pitfalls:
Depending on the issue you want to investigate, other tools can also be helpful:
- For MonoBehaviour scripts that take a long time but don’t show you exactly why that’s the case, add Profiler Markers to the code or try deep profiling to see the full call stack.
- For scripts that allocate managed memory, enable Allocation Call Stacks to see exactly where the allocations come from. Alternatively, enable deep profiling or use Project Auditor, which shows code issues filtered by memory, so you can identify all lines of code which result in managed allocations.
- Use the Frame Debugger to investigate the causes of poor draw call batching.
For comprehensive tips on optimizing your game, download these Unity expert guides for free:
CPU-bound: Render thread
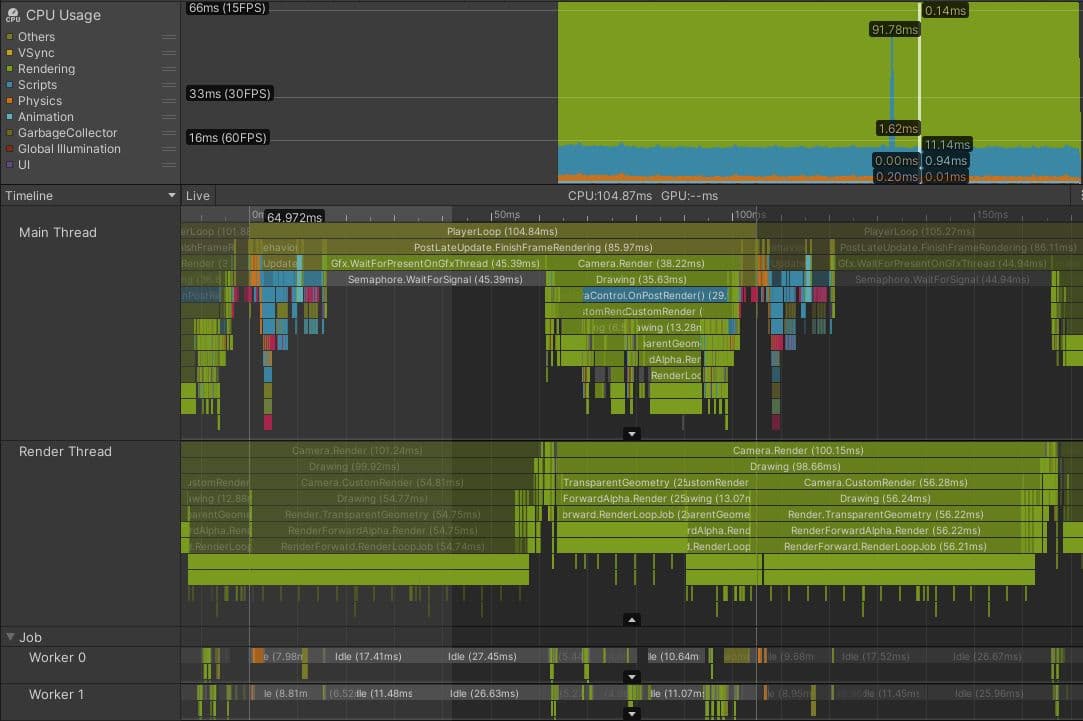
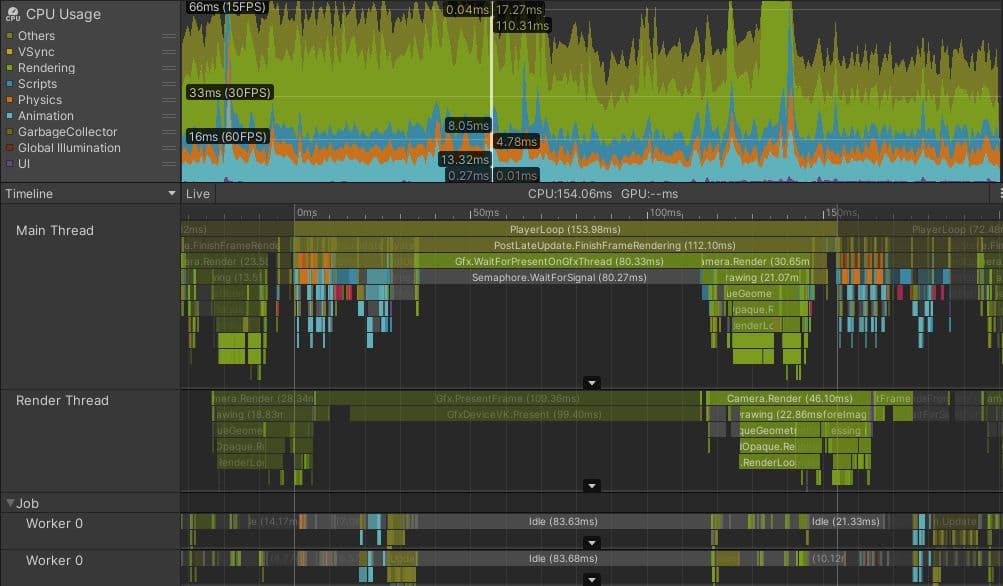
Here’s an actual project that’s bound by its render thread. This is a console game with an isometric viewpoint and a target frame budget of 33.33 ms.
The Profiler capture shows that before rendering can begin on the current frame, the main thread waits for the render thread, as indicated by the Gfx.WaitForPresentOnGfxThread marker. The render thread is still submitting draw call commands from the previous frame and isn’t ready to accept new draw calls from the main thread; it’s also spending time in Camera.Render.
You can tell the difference between markers relating to the current frame and markers from other frames, because the latter appear darker. You can also see that once the main thread is able to continue and start issuing draw calls for the render thread to process, the render thread takes over 100 ms to process the current frame, which also creates a bottleneck during the next frame.
Further investigation showed that this game had a complex rendering setup, involving nine different cameras and many extra passes caused by replacement shaders. The game was also rendering over 130 point lights using a forward rendering path, which can add multiple additional transparent draw calls for each light. In total, these issues combined to create over 3000 draw calls per frame.
Common pitfalls for render thread bottlenecks
The following are common causes to investigate for projects that are render thread-bound:
- Poor draw call batching: This applies particularly on older graphics APIs such as OpenGL or DirectX 11.
- Too many cameras: Unless you’re making a split-screen multiplayer game, the chances are that you should only ever have one active Camera.
- Poor culling: This results in too many things being drawn. Investigate your Camera’s frustum dimensions and cull layer masks.
The Rendering Profiler module shows an overview of the number of draw call batches and SetPass calls every frame. The best tool for investigating which draw call batches your render thread is issuing to the GPU is the Frame Debugger.
Tools to solve the identified bottlenecks
While the focus of this e-book is about identifying performance issues, the two complementary performance optimization guides that we previously highlighted offer suggestions on how to solve the bottlenecks, depending on whether your target platform is PC or console or mobile. In the context of render thread bottlenecks it’s worth emphasizing that Unity offers different batching systems and options depending on what problems you have identified. Here is a quick overview of some of the options which we explain in greater detail in the e-books:
- SRP Batching reduces CPU overhead by storing material data persistently in GPU memory. While it doesn’t reduce actual draw call count, it makes each draw call cheaper.
- GPU instancing combines multiple instances of the same mesh using the same material into a single draw call.
- Static Batching combines static (non-moving) meshes sharing the same material and thus can give you wins when working with a level design with many static elements.
- GPU resident drawer automatically uses GPU instancing to reduce CPU overhead and draw calls, by grouping similar GameObjects together.
- Dynamic Batching combines small meshes at runtime which can be an advantage on older mobile devices with high draw call costs. However, the downside is that the vertex transformation can also be resource-intensive.
- GPU occlusion culling uses compute shaders to determine object visibility by comparing depth buffers from current and previous frames, reducing unnecessary rendering of occluded objects without requiring pre-baked data.
Additionally, on the CPU side, techniques such as Camera.layerCullDistances can be used to reduce the number of objects sent to the render thread by culling objects based on their distance from the camera, helping alleviate CPU bottlenecks during camera culling.
These are just some of the options available. Each one of these have different advantages and drawbacks. Some are limited to certain platforms. Projects need to often use a combination of several of these systems and to do so, an understanding of how to get the most out of them.
CPU-bound: Worker threads
Projects bound by CPU threads other than the main or render threads are not that common. However, it can arise if your project uses the Data-Oriented Technology Stack (DOTS), especially if work is moved off the main thread into worker threads using the job system.
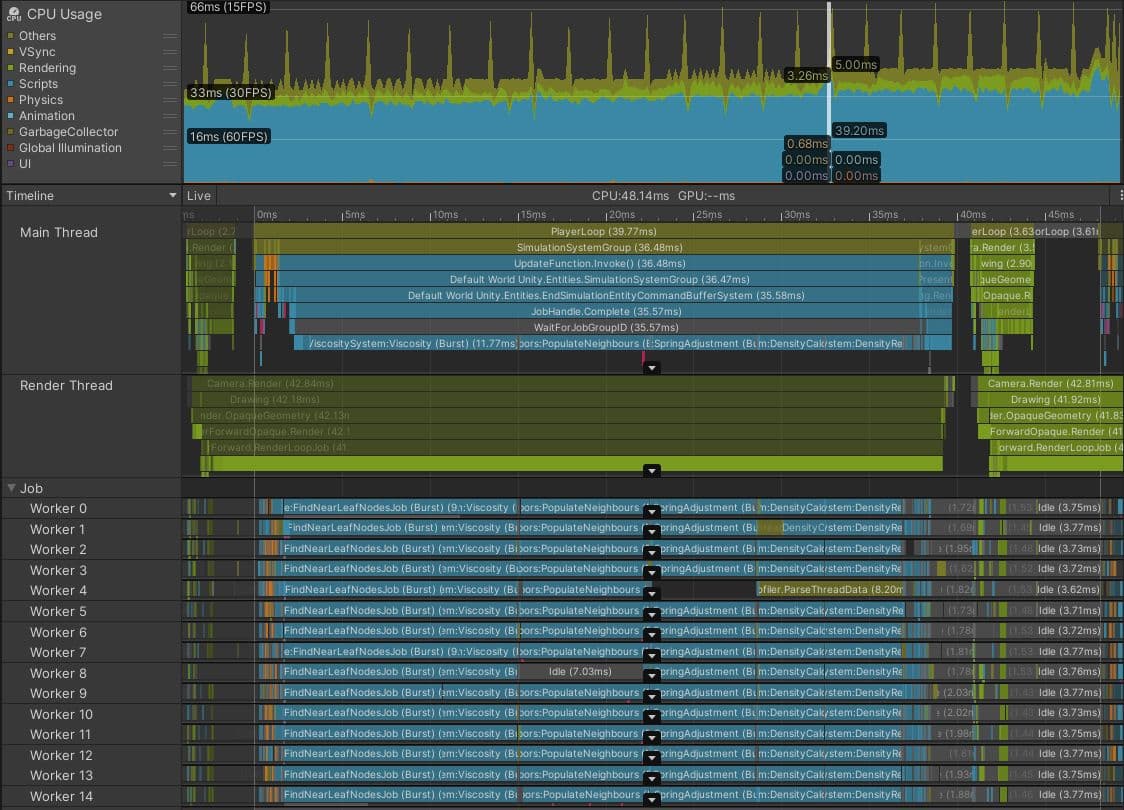
The above image is of a capture from Play mode in the Editor, showing a DOTS project running a particle fluid simulation on the CPU.
It looks like a success at first glance. The worker threads are packed tightly with Burst-compiled jobs, indicating a large amount of work has been moved off the main thread. Usually, this is a sound decision.
However, in this case, the frame time of 48.14 ms and the gray WaitForJobGroupID marker of 35.57 ms on the main thread, are signs that all is not well. WaitForJobGroupID indicates the main thread has scheduled jobs to run asynchronously on worker threads, but it needs the results of those jobs before the worker threads have finished running them. The blue Profiler markers beneath WaitForJobGroupID show the main thread running jobs while it waits, in an attempt to ensure the jobs finish sooner.
Although the jobs are Burst-compiled, they are still doing a lot of work. Perhaps the spatial query structure used by this project to quickly find which particles are close to each other should be optimized or swapped for a more efficient structure. Or, the spatial query jobs can be scheduled for the end of the frame rather than the start, with the results not required until the start of the next frame. Perhaps this project is trying to simulate too many particles. Further analysis of the jobs’ code is required to find the solution, so adding finer-grained Profiler markers can help identify their slowest parts.
The jobs in your project might not be as parallelized as in this example. Perhaps you just have one long job running in a single worker thread. This is fine, so long as the time between the job being scheduled and the time it needs to be completed is long enough for the job to run. If it isn’t, you will see the main thread stall as it waits for the job to complete, as in the screenshot above.
Common pitfalls for worker thread bottlenecks
Common causes of sync points and worker thread bottlenecks include:
- Jobs not being compiled by the Burst compiler
- Long-running jobs on a single worker thread instead of being parallelized across multiple worker threads
- Insufficient time between the point in the frame when a job is scheduled and the point when the result is required
- Multiple “sync points” in a frame, which require all jobs to complete immediately
You can use the Flow Events feature in the Timeline view of the CPU Usage Profiler module to investigate when jobs are scheduled and when their results are expected by the main thread.
For more information about writing efficient DOTS code, see the DOTS Best Practices guide.
GPU-bound
Your application is GPU-bound if the main thread spends a lot of time in Profiler markers like Gfx.WaitForPresentOnGfxThread, and your render thread simultaneously displays markers like Gfx.PresentFrame or <GraphicsAPIName>.WaitForLastPresent.
The best way of getting GPU frame times is using a target platform-specific GPU profiling tool, but not all devices make it easy to capture reliable data.
The FrameTimingManager API can be helpful in those cases, providing low-overhead, high-level frame times both on the CPU and GPU.
The above capture was taken on an Android mobile phone using the Vulkan graphics API. Although some of the time spent in Gfx.PresentFrame in this example might be related to waiting for VSync, the extreme length of this Profiler marker indicates the majority of this time is spent waiting for the GPU to finish rendering the previous frame.
In this game, certain gameplay events triggered the use of a shader that tripled the number of draw calls rendered by the GPU. Common issues to investigate when profiling GPU performance include:
- Expensive full-screen post-processing effects, like Ambient Occlusion and Bloom
- Expensive fragment shaders caused by:
- Branching logic inside shader code
- Using full float precision rather than half precision, especially on mobile
- Excessive use of registers, which affect the wavefront occupancy of GPUs
- Overdraw in the Transparent render queue caused by:
- Inefficient UI rendering
- Overlapping or excessive use of particle systems
- Post-processing effects
- Excessively high screen resolutions, such as:
- 4K displays
- Retina displays on mobile devices
- Micro triangles caused by:
- Dense mesh geometry
- Lack of Level of Detail (LOD) systems, which is a particular problem on mobile GPUs, but can affect PC and console GPUs as well
- Cache misses and wasted GPU memory bandwidth caused by:
- Uncompressed textures
- High-resolution textures without mipmaps
- Geometry or tessellation shaders, which may be run multiple times per frame if dynamic shadows are enabled
If your application appears to be GPU-bound you can use the Frame Debugger as a quick way to understand the draw call batches that are being sent to the GPU. However, this tool can’t present any specific GPU timing information, only how the overall scene is constructed.
The best way to investigate the cause of GPU bottlenecks is to examine a GPU capture from a suitable GPU profiler. Which tool you use depends on the target hardware and the chosen graphics API. See the profiling and debugging tools section in the e-book for more information.

Find more best practices and tips from the Unity best practices hub. Choose from over 30 guides, created by industry experts, and Unity engineers and technical artists, that will help you develop efficiently with Unity’s toolsets and systems.