How to use SQL Data Explorer to analyze game data
Start exploring your data
Use Unity Gaming Services (UGS) Data Explorer to filter and use your data based on metrics or Events, and group them by platform, country, or version.
With basic knowledge of SQL (Structured Query Language), you can level up your analysis and dig deeper into your data using the SQL Data Explorer inside of UGS. Use this feature to build and execute queries, plot results into different types of visualizations, add visualizations to Custom Dashboards, and export your data to use with other analysis tools. Find SQL Data Explorer in the UGS Analytics panel of the Unity Dashboard.
Russell Young, one of Unity’s Analytics Consultants, has tips and ideas to start your SQL Data Explorer adventures.
Starting out on your mission
See our collection of recipes in the SQL Cookbook to explore the rich data in UGS. Note that UGS makes use of the Snowflake flavor of SQL.
One of the cookbook queries looks at mission statistics. Let’s adapt that code to take a quick look at mission failure rates in our pretend game. This uses custom events we’ve created to track players’ engagement with missions, with our missionID parameter.

Using the default EVENTS table
For this query, we’ll use the default EVENTS table. This table includes granular data for every event recorded in our game.

Limiting your query for efficiency
Note that we used a date filter here to limit our query and keep it efficient. Without this limit, the query would run over the full 365 days of data that is queryable by default in SQL Data Explorer. Also, it’s always more efficient to specify which columns you’re interested in rather than using SELECT *.
Phrases like EVENT_JSON:missionID::INTEGER seem intimidating, but if you type ‘missionID’ and use autocomplete, SQL Data Explorer generates the JSON syntax for you – assuming that you have that parameter set up in your own game.

Plotting your results
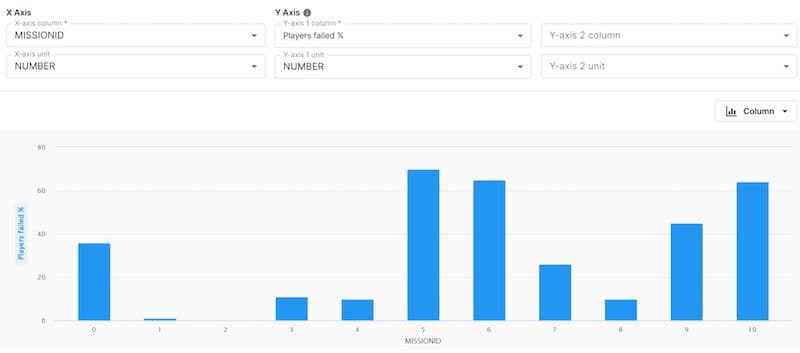
After running the query, we can plot our results to see the story in the data. Charts currently support up to two Y axes and one X axis. Axis labels can easily be renamed using the ‘as’ expression in your SQL query; in this case, our Y axis takes the name we defined: “Players failed %”.
We see that more than one in three players has failed in our first mission (missionID 0), so we can fine-tune the mission difficulty to give users a more positive first experience.
Tip: If you have some NULL values in your data and find that this causes an axis to look strange, use coalesce(yourParameter, 0) to fill in the blanks.

Using the pivot tool
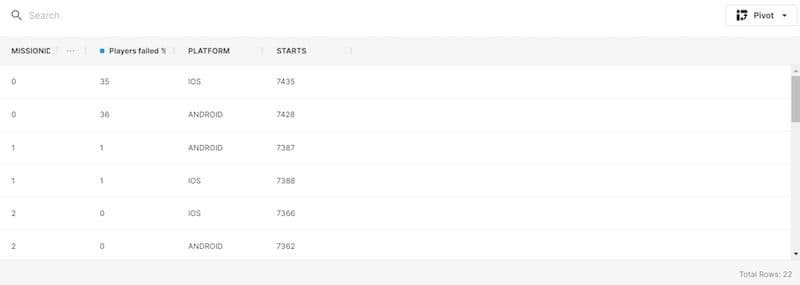
When we run a query, we get a table of our results. Add PLATFORM to our query; in the image above, you’ll see how the table looks now. Notice the ‘Pivot’ button on the right. This is useful for re-shaping our data without needing to rewrite our query.

Tweaking the data
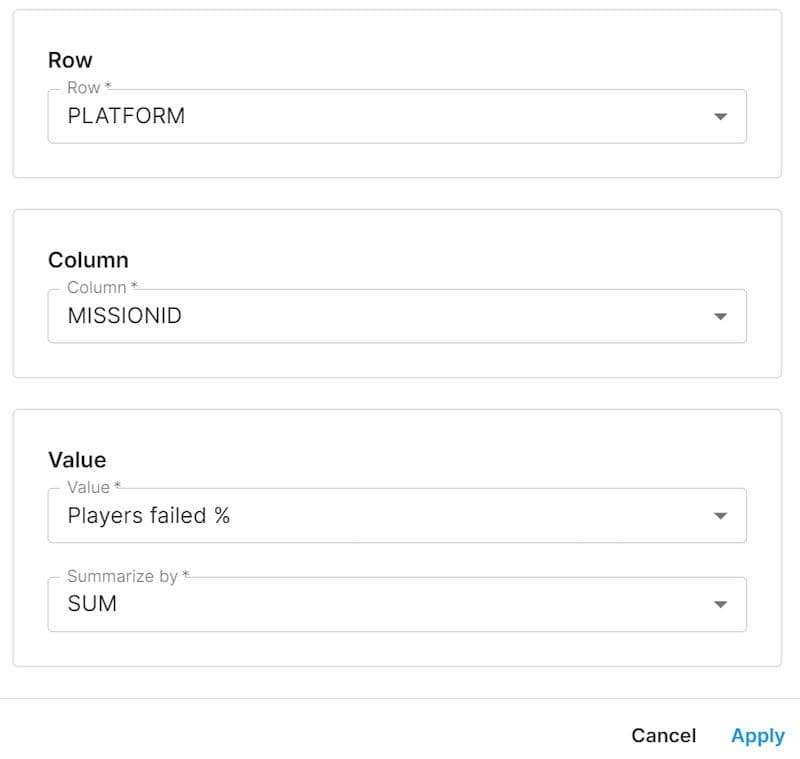
In our example we could use the pivot tool to tweak our data to get PLATFORM in the rows and MISSIONID as the columns.

Seeing the results
Tweaking the table shows that there was little difference in mission failures between platforms.
Increasing your query speed
As your game becomes increasingly successful and your player base grows, you might find that even simple queries take a significant time to run.
Let’s say you want to run this basic query against your data:
Sampling your data
You might expect it to run fairly quickly, but with a large dataset that isn’t always the case. Take advantage of the shape of our warehouse and the fact that user_ids are stored as a hash to use a quick method to reduce the number of included users to increase the query speed.
Here, we’re splitting our users into 100 pseudo-randomly assigned and numbered buckets and looking at bucket number 63.
Adding this code into simple queries won’t make much difference, but as we increase computational complexity, filtering data in this way is more and more critical. Even in our pretend game, we found that this revised version of our query ran 75% faster than the original. This saves time and money to get insights on sample subsets of users without having to process entire datasets.
Using approximate_count_distinct
In those above queries, we used count(distinct…) to calculate our number of individual players and event combinations. One way to improve our query speed, if we don’t need 100% accuracy with our results, is to use approximate_count_distinct. Our previous query becomes:

Opening the Glossary panel
Until now we have only been using the main EVENTS table. As this table holds granular data on every event we have had in our game, it’s the most extensive table. To improve our queries we can use smaller objects to run our queries more efficiently.
Let’s take a look at the Glossary panel, to explore the tables we have available to query.
Aggregate tables in UGS
Alongside EVENTS, here we find all of the aggregate tables available for querying. These are all available out-of-the-box with UGS.
- The USERS table holds a single row per player alongside their lifetime metrics in the game, such as event counts, total playtime, total spend, etc.
- FACT_USER_SESSIONS_DAY includes data on each session for each player.
- FACT_EVENT_TYPE_USERS_DAY consists of a row for each event that a player has sent each day, along with a total count.
- FACT_WAU_USERS and FACT_MAU_USERS include profile data for users who played within the previous week or month on a given day.
Between FACT_EVENT_TYPE_USERS_DAY and FACT_USER_SESSIONS_DAY, you can probably answer 80%+ of most queries on smaller objects.
Using FACT_EVENT_TYPE_USERS_DAY
For example, in our first query, we were looking at mission fail rates. We could also use the FACT_EVENT_TYPE_USERS_DAY to calculate overall failure rates each day, with the NUMBER_OF_EVENTS count stored in this table.
We’ll also use one of these tables in our next query:

Identifying players by specific criteria
Use this query to see the event stream for players that meet specific criteria. It’s useful for QA and debugging because – by using the USERS table mentioned above – you’ll get a different user every time you run it.
If, for example, you suspect that events aren’t being recorded correctly for players who installed a certain version of your game, you can run the query below. What comes back is the event stream of a random player running the game version that seems to be experiencing problems. Do this a few times, and you can quickly start to spot patterns in the data.
Tip: If you want to comment out multiple lines, use the keyboard shortcut CTRL+/
Using newly defined variables
You may be used to writing SQL queries in languages other than Snowflake – for example, if you used the previous deltaDNA Data Mining tool, you likely wrote queries in Vertica.
You can now refer to newly defined variables without needing to include them in a common table expression (CTE) first. For example, this query runs successfully in SQL Data Explorer – but in the original deltaDNA, it would have raised a “column ‘rice’ does not exist” error:
Getting more from your data
There’s a lot of potential in SQL Explorer. There’s far more to discover in UGS Analytics, including many chart options such as pies and stacked bar charts. Direct Access gives you direct access to your Analytics data through Snowflake.
To fast-track your insights and get support building your queries and dashboards, contact us.
Further reading