
Managing GPU usage for PC and console games
This is the third in a series of articles that unpacks optimization tips for your Unity projects. Use them as a guide for running at higher frame rates with fewer resources. Once you’ve tried these best practices, be sure to check out the other pages in the series:
- Configuring your Unity project for stronger performance
- Performance optimization for high-end graphics
- Advanced programming and code architecture
- Enhanced physics performance for smooth gameplay
See our latest optimization guides for Unity 6 developers and artists:
Optimizing GPU usage in PC and console games
Understand the limitations of your target hardware and how to profile the GPU to optimize the rendering of your graphics. Try these tips and best practices to reduce the workload on the GPU.
When profiling, it’s useful to start with a benchmark to tell you what profiling results you should expect from specific GPUs.
See GFXBench for a great list of different industry-standard benchmarks for GPUs and graphics cards. The website provides a good overview of the current GPUs available and how they stack up against each other.
Watch the rendering statistics
Click the Stats button in the top right of the Game view. This window shows you real-time rendering information about your application during Play mode. Use this data to help optimize performance:
- fps: Frames per second
- CPU Main: Total time to process one frame (and update the Editor for all windows)
- CPU Render: Total time to render one frame of the Game view
- Batches: Groups of draw calls to be drawn together
- Tris (triangles) and Verts (vertices): Mesh geometry
- SetPass calls: The number of times Unity must switch shader passes to render the GameObjects on-screen; each pass can introduce extra CPU overhead.
Note: In-Editor fps does not necessarily translate to build performance. We recommend that you profile your build for the most accurate results. Frame time in milliseconds is a more accurate metric than frames per second when benchmarking. Learn more in the e-book Ultimate guide to profiling Unity games (Unity 6 edition).
Use draw call batching
To draw a GameObject, Unity issues a draw call to the graphics API (e.g. OpenGL, Vulkan, or Direct3D). Each draw call is resource intensive. State changes between draw calls, such as switching materials, can cause performance overhead on the CPU side.
PC and console hardware can push a lot of draw calls, but the overhead of each call is still high enough to warrant trying to reduce them. On mobile devices, draw call optimization is vital. You can achieve this with draw call batching.
Draw call batching minimizes these state changes and reduces the CPU cost of rendering objects. Unity can combine multiple objects into fewer batches using several techniques:
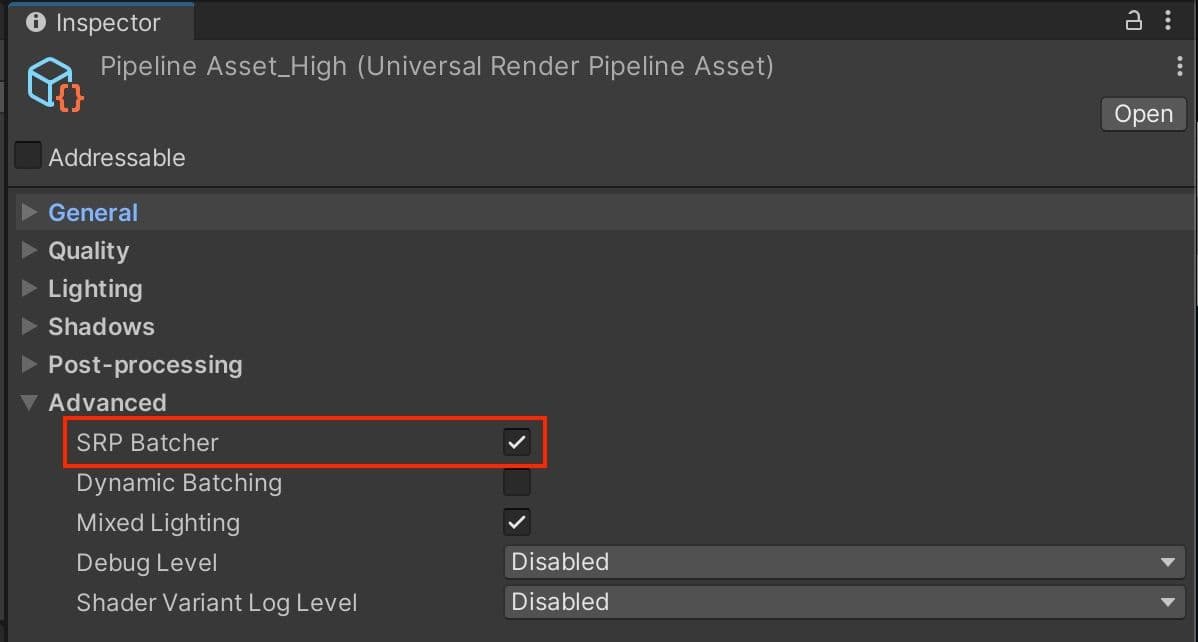
- SRP Batching: If you are using HDRP or URP, enable the SRP Batcher in your Pipeline Asset under Advanced. When using compatible shaders, the SRP Batcher reduces the GPU setup between draw calls and makes material data persistent in GPU Memory. This can speed up your CPU rendering times significantly. Use fewer Shader Variants with a minimal amount of Keywords to improve SRP batching. Consult this SRP documentation to see how your project can take advantage of this rendering workflow.
- GPU instancing: If you have a large number of identical objects (e.g., buildings, trees, grass, and so on with the same mesh and material), use GPU instancing. This technique batches them using graphics hardware. To enable GPU Instancing, select your material in the Project window, and, in the Inspector, check Enable Instancing.
- Static batching: For non-moving geometry, Unity can reduce draw calls for any meshes sharing the same material. It is more efficient than dynamic batching, but it uses more memory.Mark all meshes that never move as Batching Static in the Inspector. Unity combines all static meshes into one large mesh at build time. The StaticBatchingUtility also allows you to create these static batches yourself at runtime (for example, after generating a procedural level of non-moving parts).
- Dynamic Batching: For small meshes, Unity can group and transform vertices on the CPU, then draw them all in one go. Note: Do not use this unless you have enough low-poly meshes (no more than 300 vertices each and 900 total vertex attributes). Otherwise, enabling it will waste CPU time looking for small meshes to batch.
You can maximize batching with a few simple rules:
- Use as few textures in a scene as possible. Fewer textures require fewer unique materials, making them easier to batch. Additionally, use texture atlases wherever possible.
- Always bake lightmaps at the largest atlas size possible. Fewer lightmaps require fewer material state changes, but keep an eye on the memory footprint.
- Be careful not to instance materials unintentionally. Accessing Renderer.material in scripts duplicates the material and returns a reference to the new copy. This breaks any existing batch that already includes the material. If you wish to access the batched object’s material, use Renderer.sharedMaterial instead.
- Keep an eye on the number of static and dynamic batch counts versus the total draw call count by using the Profiler or the rendering stats during optimizations.
Please refer to the draw call batching documentation for more information.
Check the Frame Debugger
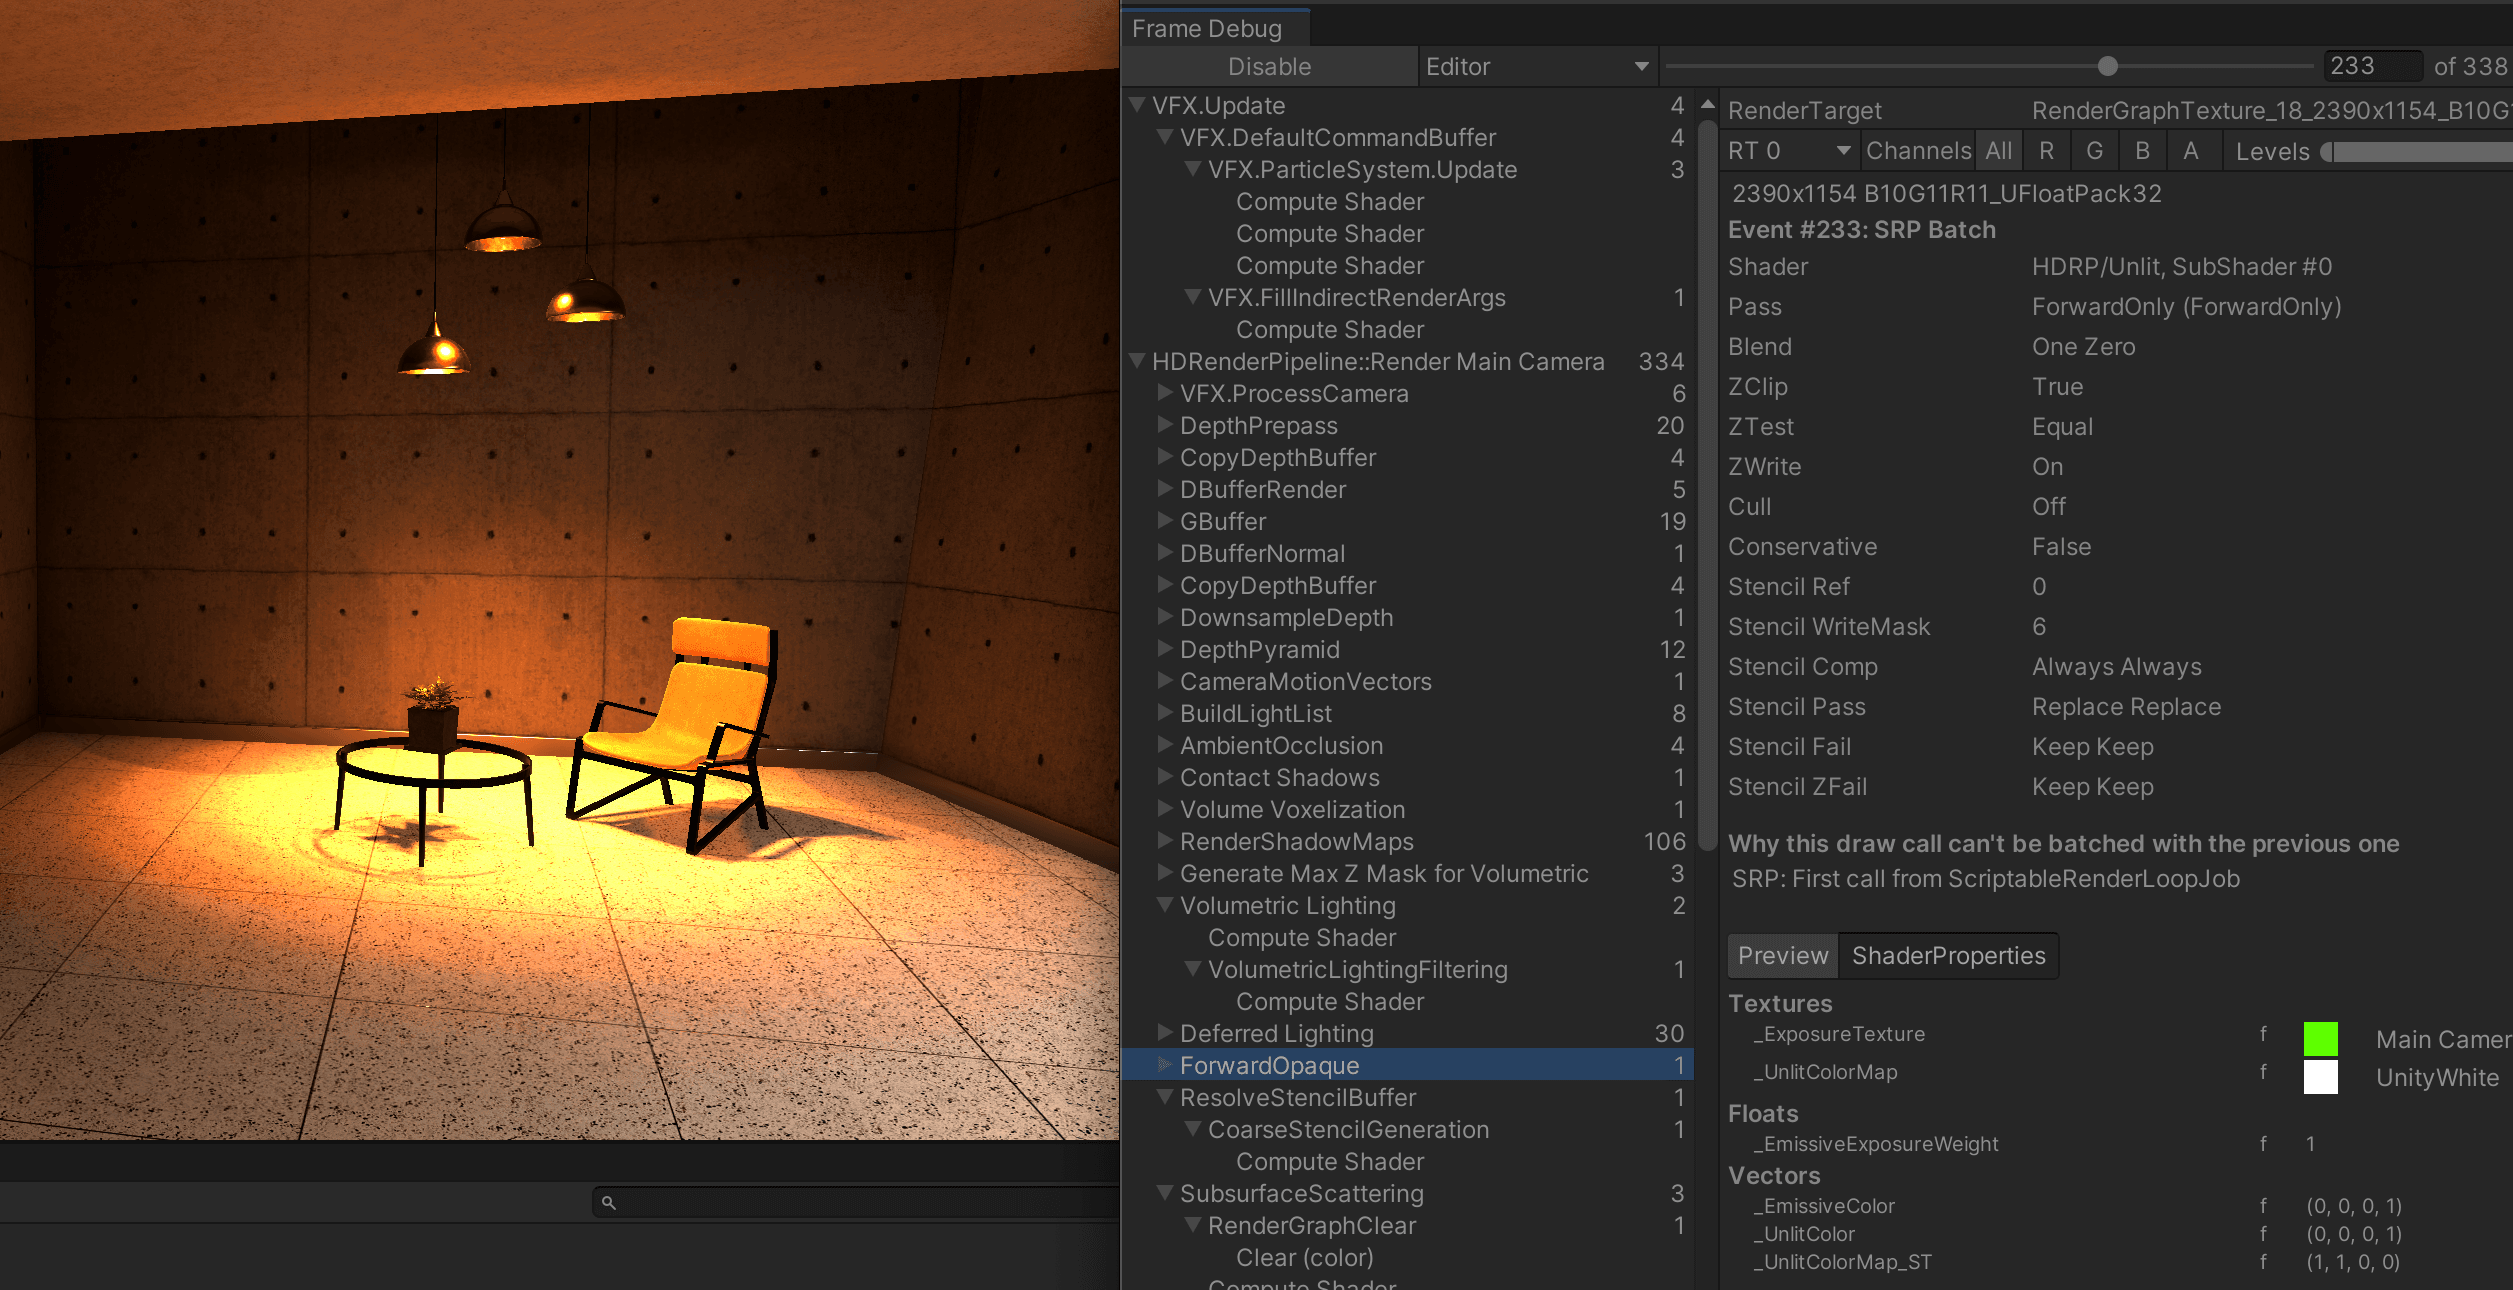
The Frame Debugger allows you to freeze playback on a single frame and step through how Unity constructs a scene to identify optimization opportunities. Look for GameObjects that render unnecessarily, and disable those to reduce draw calls per frame.
Note: The Frame Debugger does not show individual draw calls or state changes. Only native GPU profilers give you detailed draw call and timing information. However, the Frame Debugger can still be very helpful in debugging pipeline problems or batching issues.
One advantage of the Unity Frame Debugger is that you can relate a draw call to a specific GameObject in the scene. This makes it easier to investigate certain issues that may not be possible in external frame debuggers.
For more information, read the Frame Debugger documentation, and see the section
Optimize fill rate and reduce overdraw
Fill rate refers to the number of pixels the GPU can render to the screen each second.
If your game is limited by fill rate, this means that it’s trying to draw more pixels per frame than the GPU can handle.
Drawing on top of the same pixel multiple times is called overdraw. Overdraw decreases fill rate and costs extra memory bandwidth. The most common causes of overdraw are:
- Overlapping opaque or transparent geometry
- Complex shaders, often with multiple render passes
- Unoptimized particles
- Overlapping UI elements
While you want to minimize its effect, there is no one-size-fits-all approach to solving overdraw problems. Begin by experimenting with the above factors to reduce their impact.
Reduce the batch count
As with other platforms, optimization on console will often mean reducing draw call batches. There are a few techniques that might help.
- Use Occlusion culling to remove objects hidden behind foreground objects and reduce overdraw. Be aware this requires additional CPU processing, so use the Profiler to ensure moving work from the GPU to CPU is beneficial.
- GPU instancing can also reduce your batches if you have many objects that share the same mesh and material. Limiting the number of models in your scene can improve performance. If it’s done artfully, you can build a complex scene without making it look repetitive.
- The SRP Batcher can reduce the GPU setup between DrawCalls by batching Bind and Draw GPU commands. To benefit from this SRP batching, use as many materials as needed, but restrict them to a small number of compatible shaders (e.g., Lit and Unlit shaders in URP and HDRP).
Pay attention to culling
Occlusion culling disables GameObjects that are fully hidden (occluded) by other GameObjects. This prevents the CPU and GPU from using time to render objects that will never be seen by the Camera.
Culling happens per camera. It can have a large impact on performance, especially when multiple cameras are enabled concurrently. Unity uses two types of culling, frustum culling and occlusion culling.
Frustum culling is performed automatically on every Camera. It prevents GameObjects that are outside of the View Frustum from being rendered, helping to optimize performance.
You can set per-layer culling distances manually via Camera.layerCullDistances. This allows you to cull small GameObjects at a distance shorter than the default farClipPlane.
Organize GameObjects into Layers. Use the layerCullDistances array to assign each of the 32 layers a value less than the farClipPlane (or use 0 to default to the farClipPlane).
Unity culls by layer first, keeping GameObjects only on layers the Camera uses. Afterwards, frustum culling removes any GameObjects outside the camera frustum. Frustum culling is performed as a series of jobs to take advantage of available worker threads.
Each layer culling test is very fast (essentially just a bit mask operation). However, this cost could still add up with a very large number of GameObjects. If this becomes a problem for your project, you may need to implement some system to divide your world into “sectors” and disable sectors that are outside the Camera frustum in order to relieve some of the pressure on Unity’s layer/frustum culling system.
Occlusion culling removes any GameObjects from the Game view if the Camera cannot see them. Use this feature to prevent rendering of objects hidden behind other objects since these can still render and cost resources. For example, rendering another room is unnecessary if a door is closed and the Camera cannot see into the room.
Enabling occlusion culling can significantly increase performance but can also require more disk space, CPU time, and RAM. Unity bakes the occlusion data during the build and then needs to load it from disk to RAM while loading a scene.
While frustum culling outside the camera view is automatic, occlusion culling is a baked process. Simply mark your objects as Static.Occluders or Occludees, then bake through the Window > Rendering > Occlusion Culling dialog.
Check out the Working with Occlusion Culling tutorial for more information.
Leverage dynamic resolution
Allow Dynamic Resolution is a Camera setting that allows you to dynamically scale individual render targets to reduce workload on the GPU. In cases where the application’s frame rate reduces, you can gradually scale down the resolution to maintain a consistent frame rate.
Unity triggers this scaling if performance data suggests that the frame rate is about to decrease as a result of being GPU-bound. You can also preemptively trigger this scaling manually with script. This is useful if you are approaching a GPU-intensive section of the application. If scaled gradually, dynamic resolution can be almost unnoticeable.
Refer to the dynamic resolution manual page for additional information and a list of supported platforms.
Check multiple Camera views
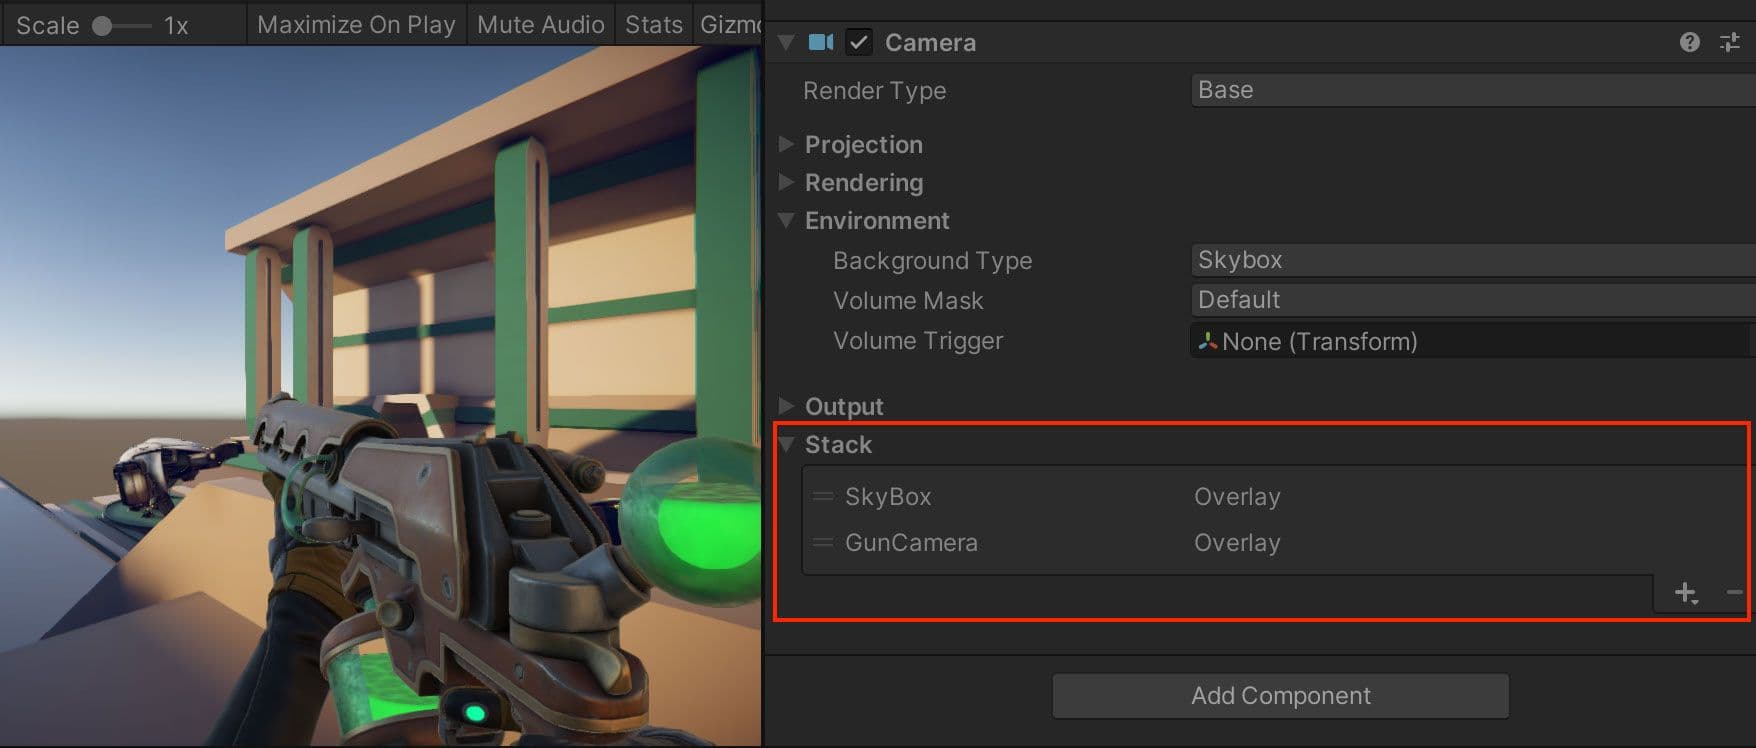
Sometimes you may need to render from more than one point of view during your game. For example, it’s common in an FPS game to draw the player’s weapon and the environment separately with different fields of view (FOV). This prevents the foreground objects from feeling too distorted viewed through the wide-angle FOV of the background.
You could use Camera Stacking in URP to render more than one camera view. However, there is still significant culling and rendering done for each camera. Each camera incurs some overhead, whether it’s doing meaningful work or not. Only use Camera components required for rendering. On mobile platforms, each active camera can use up to 1 ms of CPU time, even when rendering nothing.
Use the Render Objects Renderer Feature
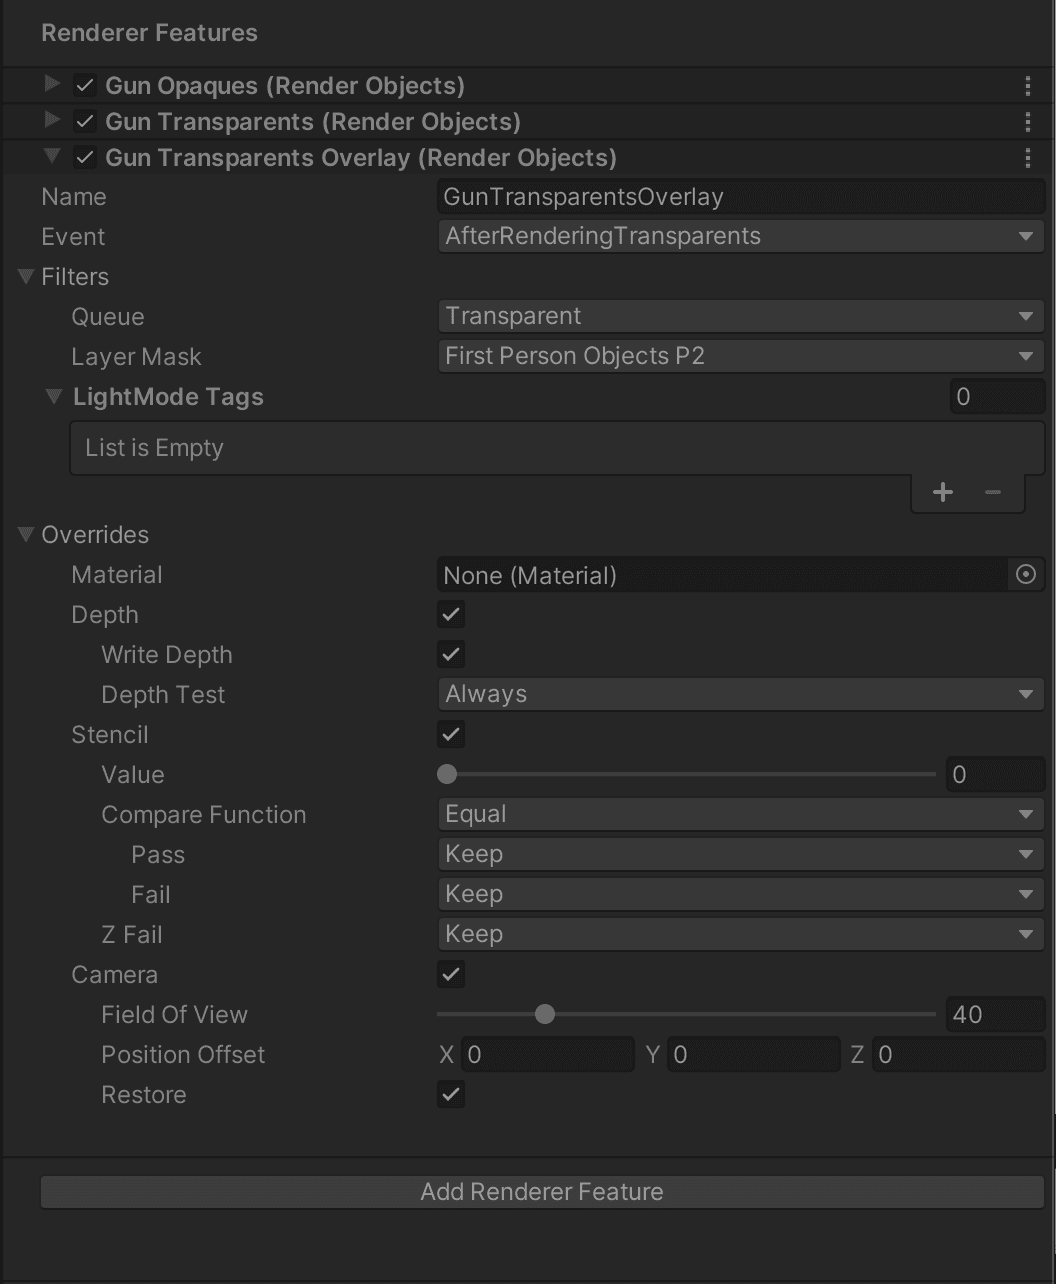
In the URP, instead of using multiple cameras, try a custom Render Objects Renderer Feature. Select Add Renderer Feature in the Renderer Data asset. Choose Render Object.
When overriding each Render Object, you can:
- Associate it with an Event and inject it into a specific timing of the render loop
- Filter by Render Queue (Transparent or Opaque) and LayerMask
- Affect the Depth and Stencil settings
- Modify the Camera settings (Field of View and Position Offset)
Use Custom Pass Volumes in HDRP
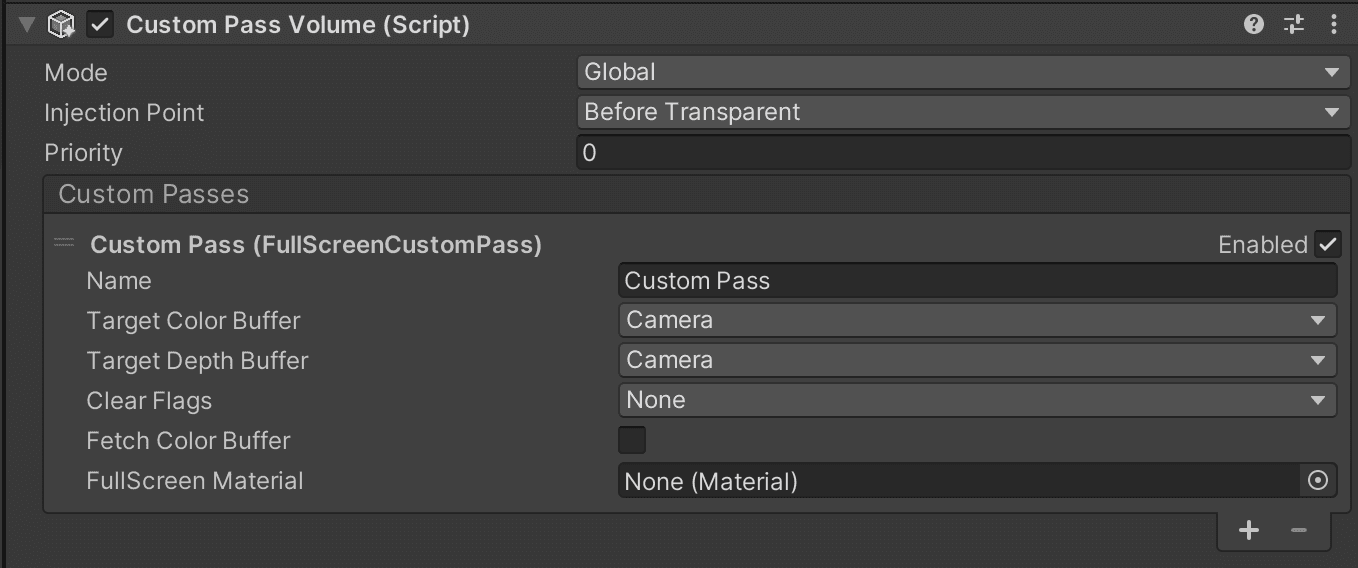
In HDRP, you can use custom passes to similar effect. Configuring a Custom Pass using a Custom Pass Volume is analogous to using an HDRP Volume.
A Custom Pass allows you to:
- Change the appearance of materials in your scene
- Change the order that Unity renders GameObjects
- Read Camera buffers into shaders
Using Custom Pass Volumes in HDRP can help you avoid using extra Cameras and the additional overhead associated with them. Custom passes have extra flexibility in how they can interact with shaders. You can also extend the Custom Pass class with C#.
Use Level of Detail
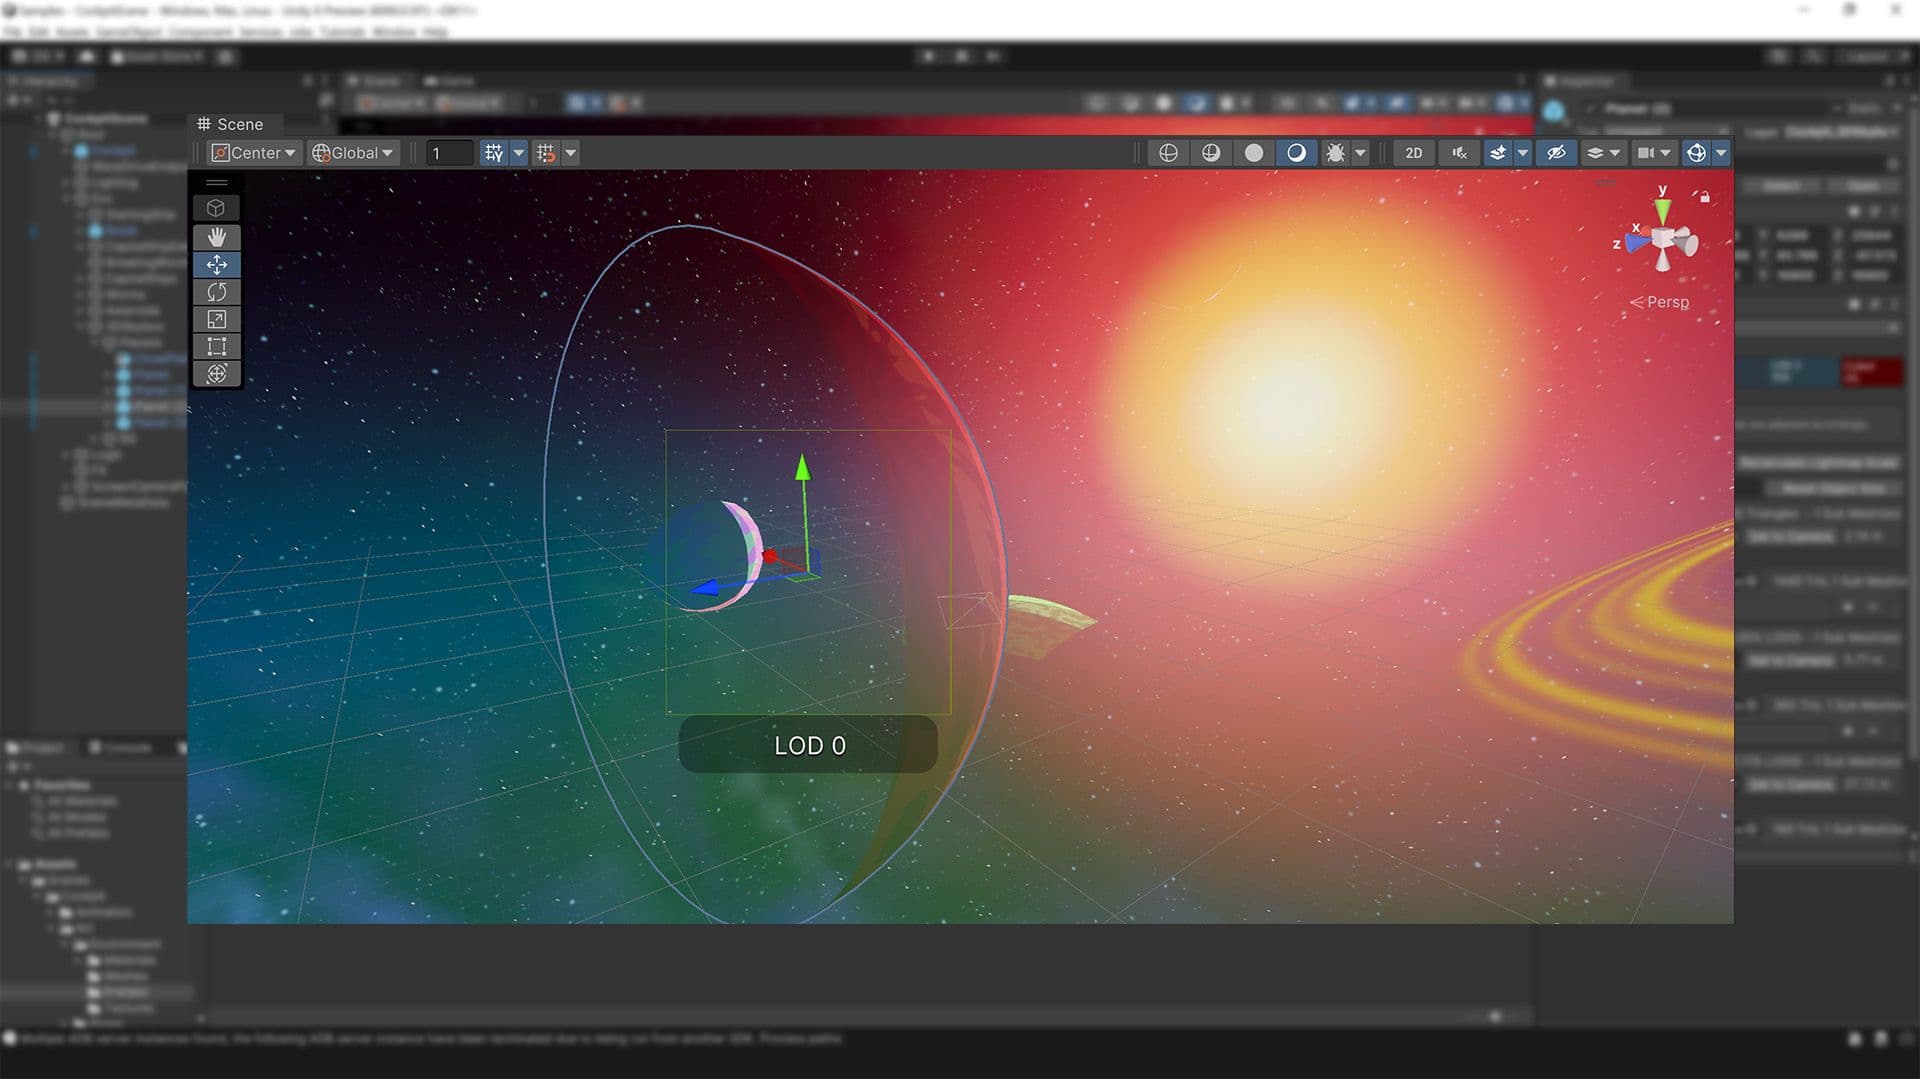
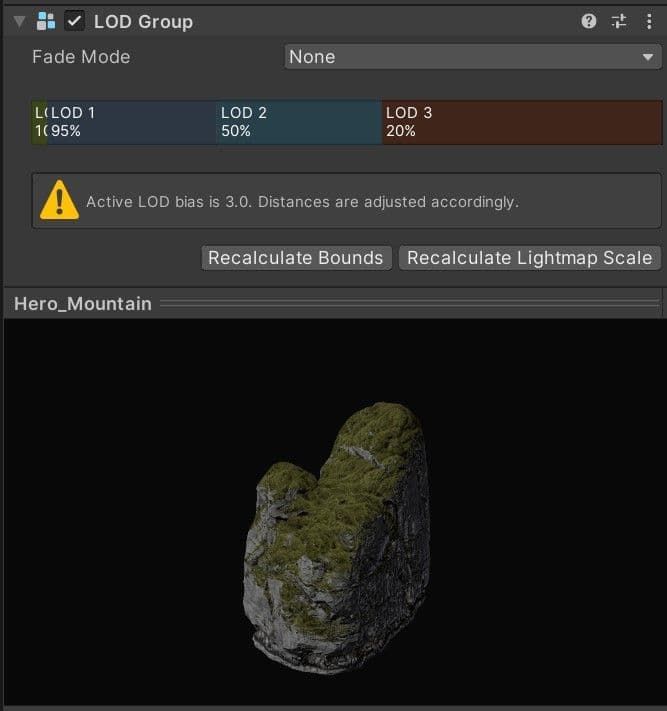
As objects move into the distance, Level of Detail (LOD) can adjust or switch them to use lower-resolution meshes with simpler materials and shaders. This strengthens GPU performance.
See the Working with LODs course on Unity Learn for more details.
Profile post-processing effects
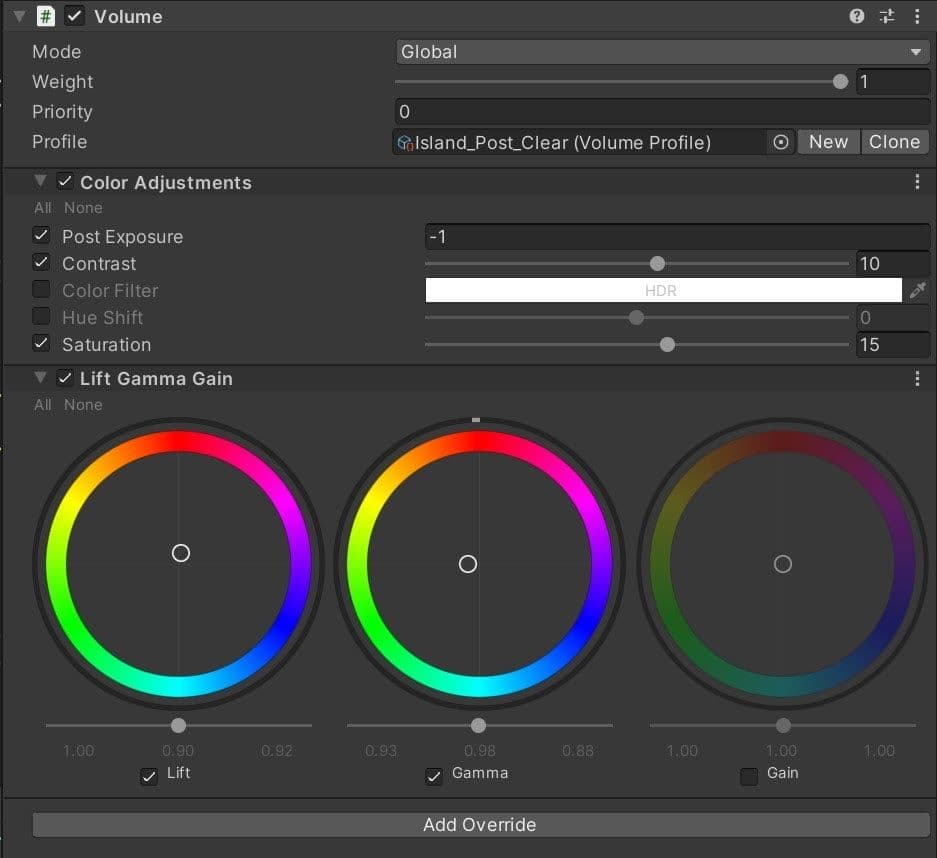
Profile your post-processing effects to see their cost on the GPU. Some fullscreen effects, like Bloom and depth of field, can be expensive, but experiment until you find a happy balance between visual quality and performance.
Post-processing tends not to fluctuate much at runtime. Once you’ve determined your Volume Overrides, allot your post effects a static portion of your total frame budget.
Avoid Tessellation shaders
Tessellation subdivides shapes into smaller versions of that shape. This can enhance detail through increased geometry. Though there are examples where tessellation does make sense, like for realistic tree bark, in general, avoid tessellation on consoles. They can be expensive on the GPU.
Replace geometry shaders with compute shaders
Like tessellation shaders, geometry and vertex shaders can run twice per frame on the GPU – once during the depth pre-pass, and again during the shadow pass.
If you want to generate or modify vertex data on the GPU, a compute shader is often a better choice than a geometry shader. Doing the work in a compute shader means that the vertex shader that actually renders the geometry can be comparatively fast and simple.
Learn more about Shader core concepts.
Aim for good wavefront occupancy
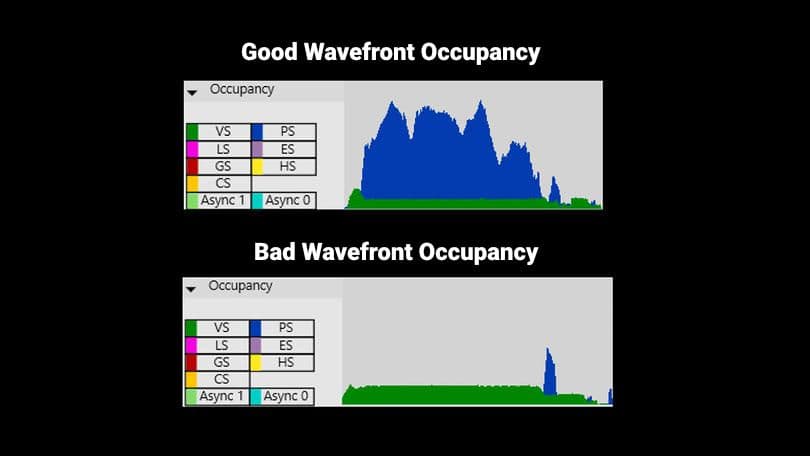
When you send a draw call to the GPU, that work splits into many wavefronts that Unity distributes throughout the available SIMDs within the GPU.
Each SIMD has a maximum number of wavefronts that can be running at one time. Wavefront occupancy refers to how many wavefronts are currently in use relative to the maximum. This measures how well you are using the GPU’s potential. Console specific performance analysis tools show wavefront occupancy in great detail.
In the example below, vertex shader wavefronts appear in green. Pixel shader wavefronts appear in blue. On the bottom graph, many vertex shader wavefronts appear without much pixel shader activity. This shows an underutilization of the GPU’s potential.
If you’re doing a lot of vertex shader work that doesn’t result in pixels, that may indicate an inefficiency. While low wavefront occupancy is not necessarily bad, it’s a metric to start optimizing your shaders and checking for other bottlenecks. For example, if you have a stall due to memory or compute operations, increasing occupancy may help performance. On the other hand, too many in-flight wavefronts can cause cache thrashing and decrease performance.
Utilize async compute
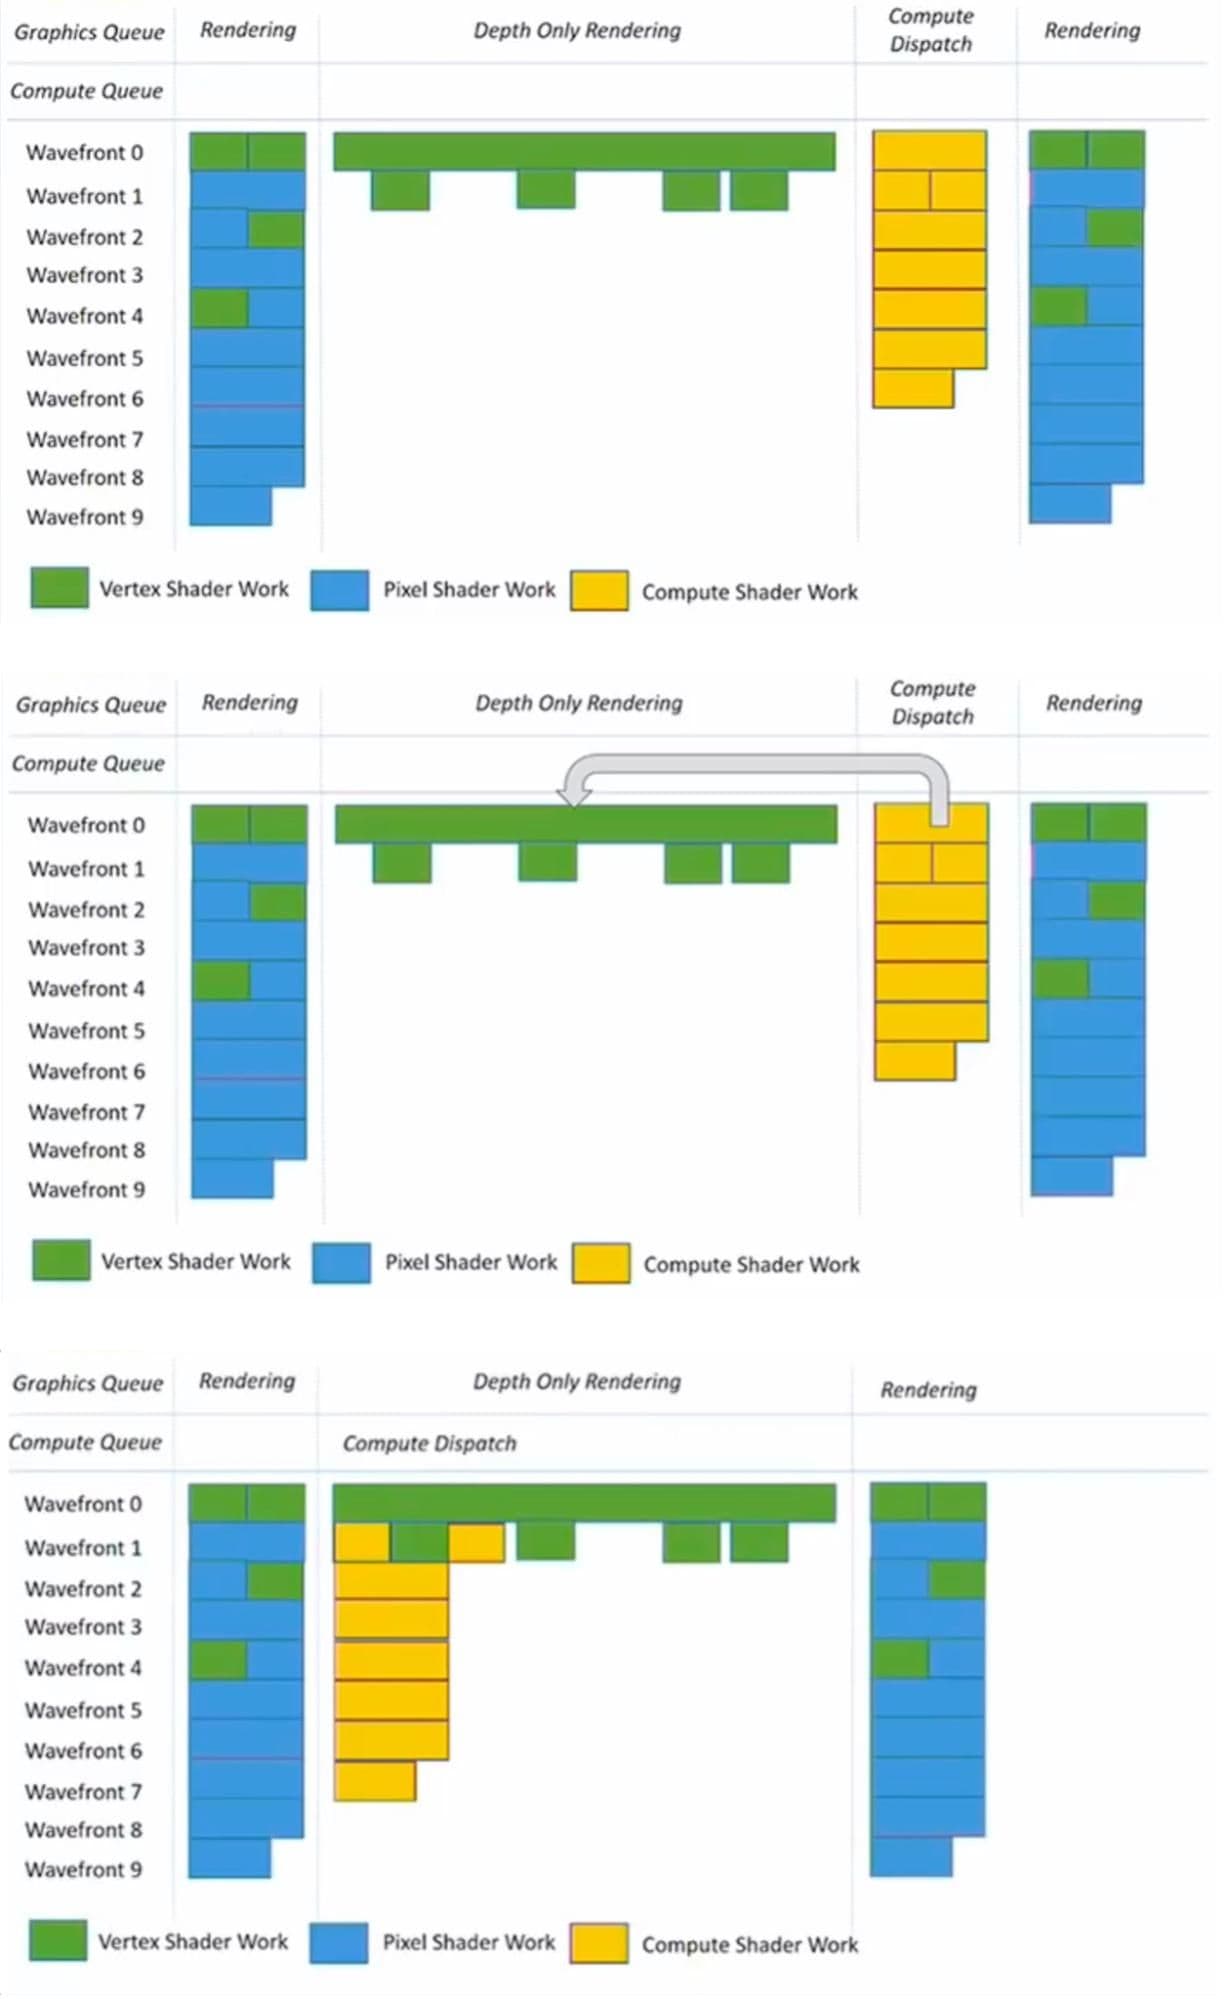
If you have intervals where you are underutilizing the GPU, Async Compute allows you to move useful compute shader work in parallel to your graphics queue. This makes better use of those GPU resources.
For example, during shadow map generation, the GPU performs depth-only rendering. Very little pixel shader work happens at this point, and many wavefronts remain unoccupied.
If you can synchronize some compute shader work with the depth-only rendering, this makes for a better overall use of the GPU. The unused wavefronts could help with Screen Space Ambient Occlusion or any task that complements the current work.
Watch this session on Optimizing performance for high-end consoles from Unite.
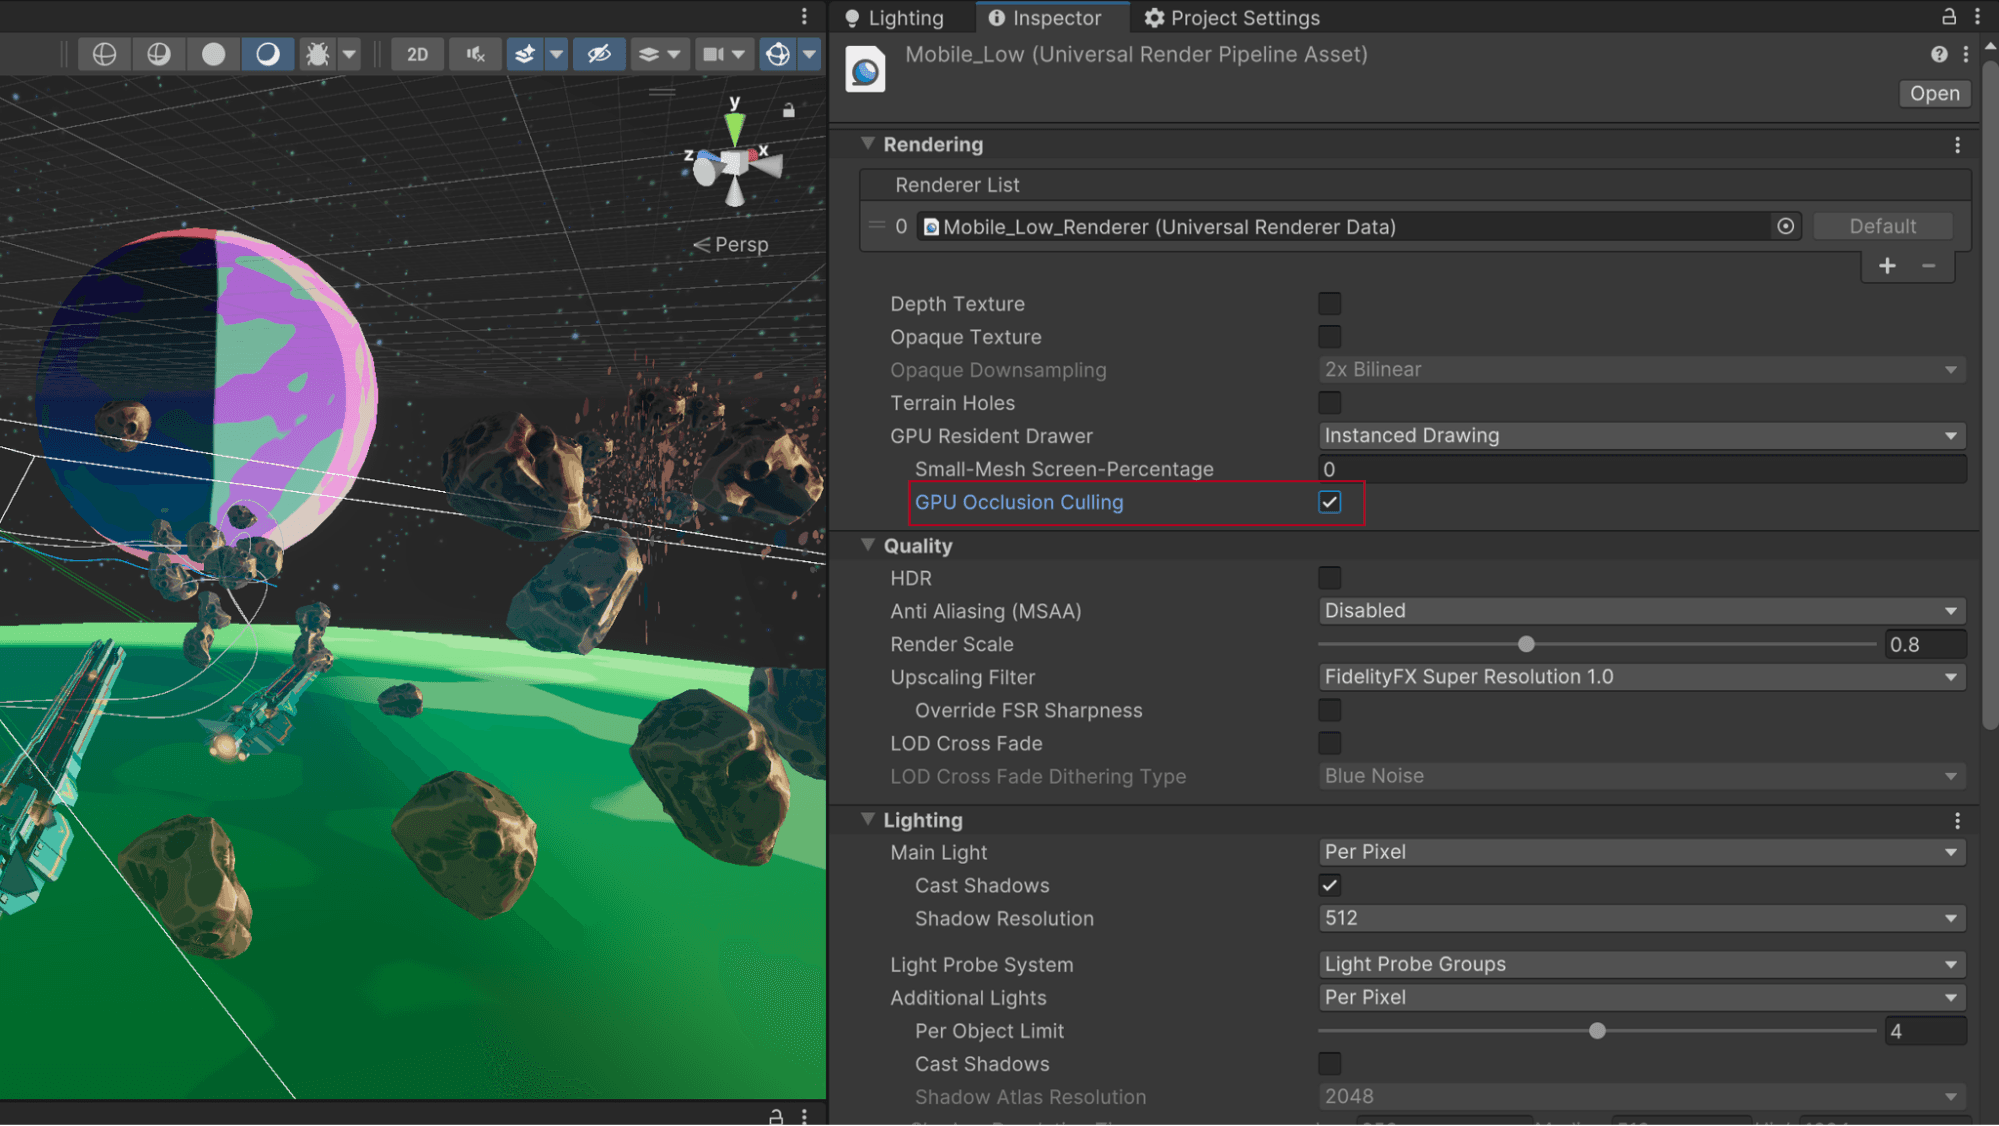
Try the GPU Resident Drawer
The GPU Resident Drawer (available for both URP and HDRP) is a GPU-driven rendering system designed to optimize CPU time, offering significant performance benefits. It supports cross-platform rendering and is designed to work out-of-the-box with existing projects.
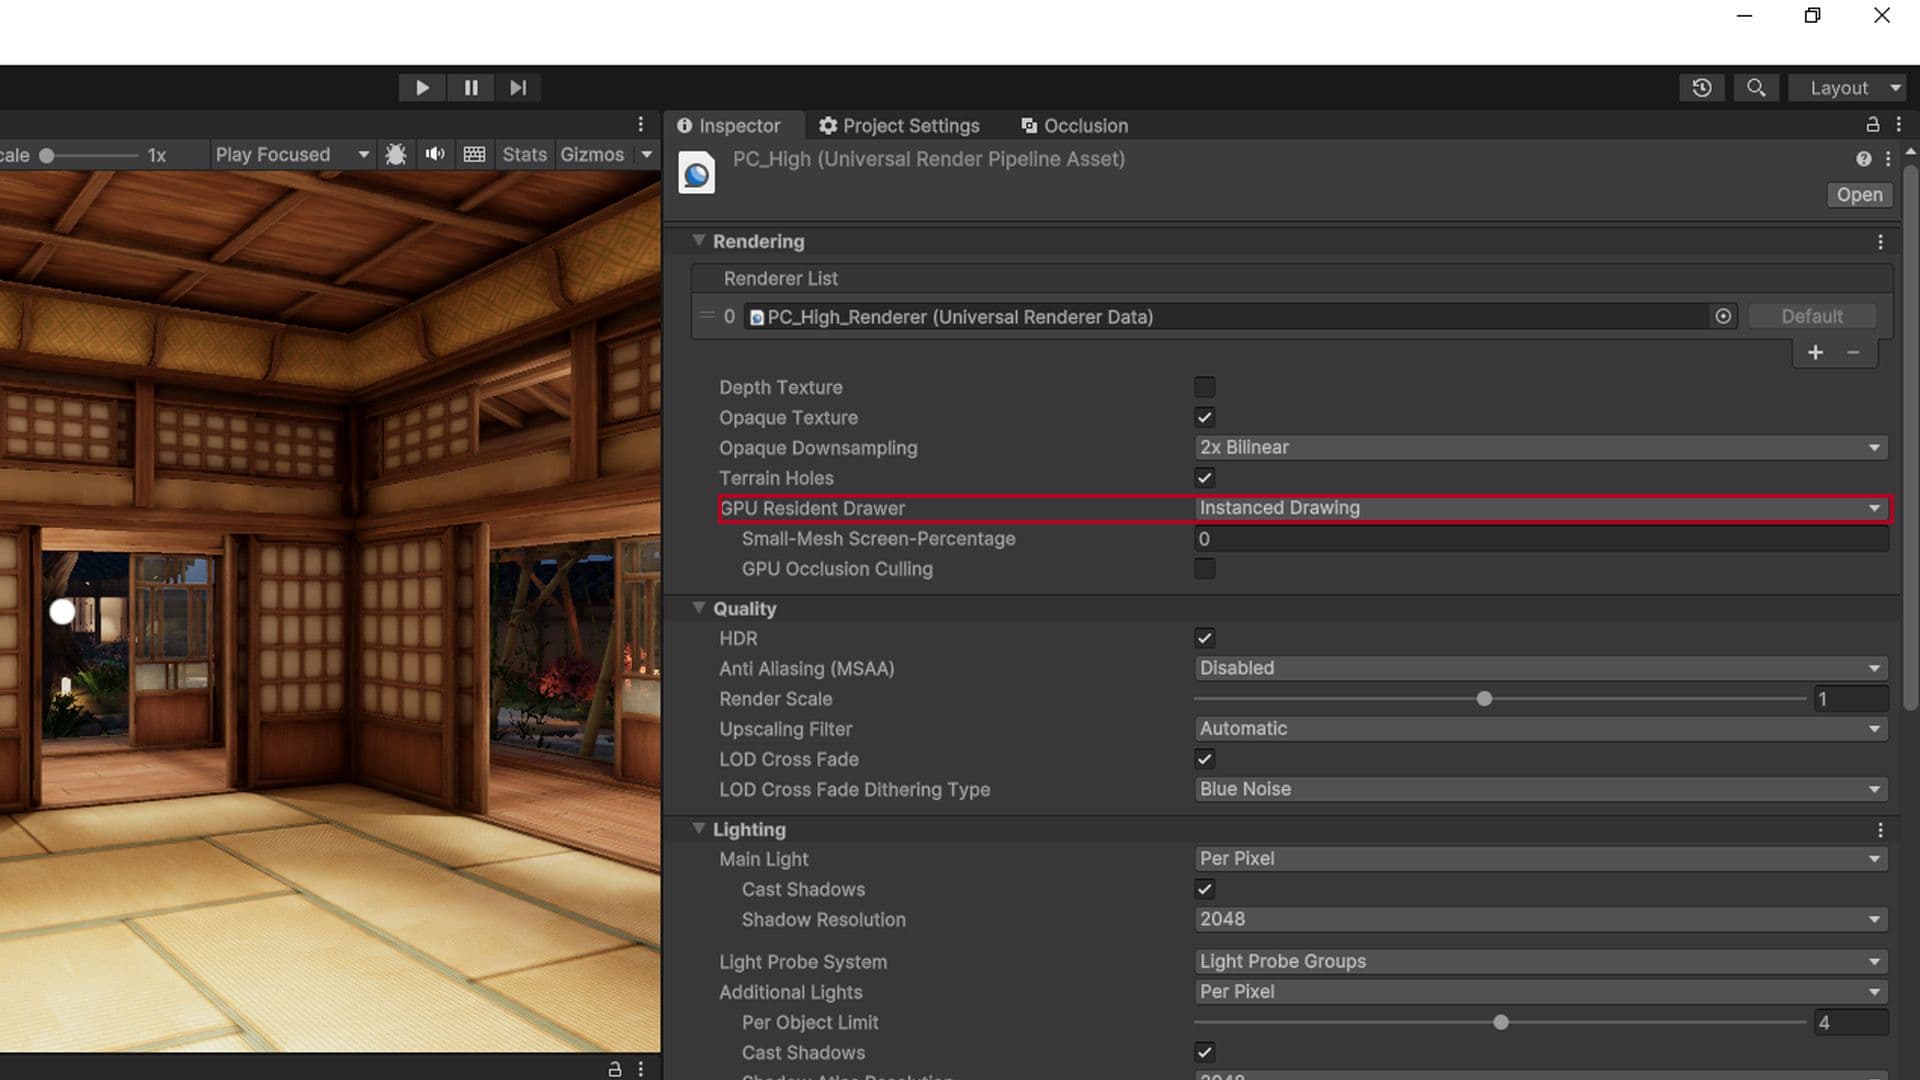
The system can be enabled within the HDRP or URP Render Pipeline Asset. Select Instanced Drawing to enable it. you can also select if you want to enable it in Play mode only or in Edit mode as well.
When you enable GPU Resident Drawer, games that are CPU bound due to a high number of draw calls can improve in performance as the amount of draw calls is reduced. The improvements you will see are dependent on the scale of your scenes and the amount of instancing you utilize. The more instanceable objects you render, the larger the benefits you will see.
Upon selecting the Instanced Drawing option you may get a message in the UI warning you that the “BatchRenderGroup Variants setting must be ‘Keep All’”. Adjusting this option in the graphics settings completes the setup for the GPU Resident Drawer.
To learn more check out our discussion thread here.
Use GPU occlusion culling
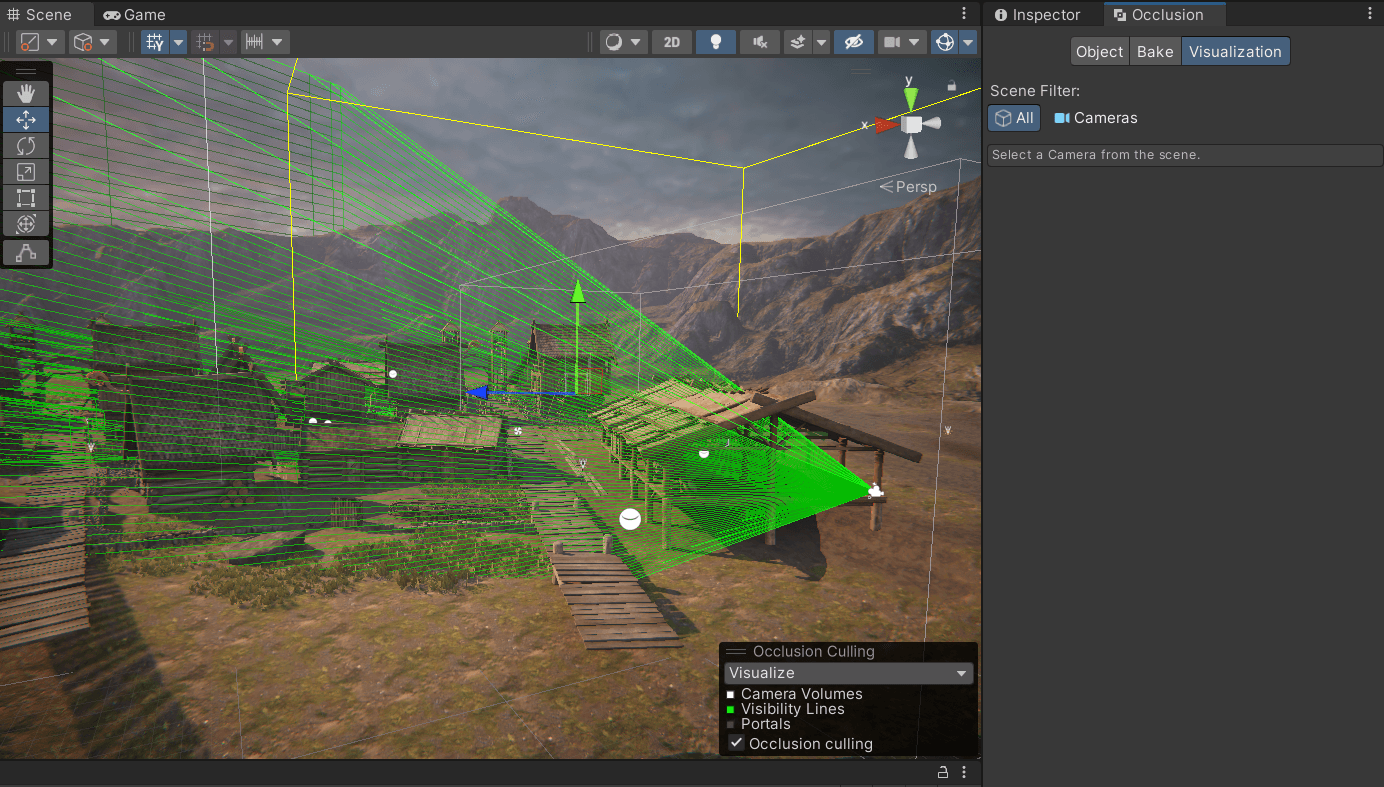
GPU occlusion culling, available for both URP and HDRP, works in tandem with the GPU Resident Drawer. It significantly boosts the performance by reducing the amount of overdraw for each frame, meaning the renderer is not wasting resources drawing things that are not seen.
To activate GPU occlusion culling locate the render pipeline asset and toggle the GPU Occlusion check box.
To enable the GPU Occlusion Culling in Debug Mode in Unity 6, go to Window > Rendering > Occlusion Culling. Here, you can visualize how objects are being culled by toggling various visualization options.

You can find many more best practices and tips for advanced Unity developers and creators from the Unity best practices hub. Choose from over 30 guides, created by industry experts, and Unity engineers and technical artists, that will help you develop efficiently with Unity’s toolsets and systems.