Speed up your programmer workflows


We recently published two blog posts, Five ways to speed up your workflows in the Editor and Speed up your artist workflows, both based on our e-book for professional developers, 70+ tips to increase productivity with Unity 2020 LTS. In this third and final blog post of the series, we focus on workflows and the features that help programmers get more done in less time. Let’s start with how you can save compilation time when playtesting.
When you enter Play mode, your project starts to run as it would in a build. Any changes you make in-Editor during Play mode will reset when you exit Play mode.
Each time that you enter Play mode in-Editor, Unity performs two significant actions:
- Domain Reload: Unity backs up, unloads, and recreates scripting states.
- Scene Reload: Unity destroys the Scene and loads it again.
These two actions take more and more time as your scripts and Scenes become more complex.
If you don’t plan on making anymore script changes, leverage the Enter Play Mode Settings (Edit > Project Settings > Editor) to save some compile time. Unity gives you the option of disabling either Domain Reload, Scene Reload, or both. This can speed up entering and exiting Play mode.
Just remember that if you plan on making further script changes, you need to re-enable Domain Reload. Similarly, if you modify the Scene Hierarchy, you should re-enable Scene Reload. Otherwise, unexpected behavior can arise.

An assembly is a C# code library, a collection of types and resources that are built to work together and form a logical unit of functionality. By default, Unity compiles nearly all of your game scripts into the predefined assembly, Assembly-CSharp.dll. This works well for small projects, but it has some drawbacks:
- Every time you change a script, Unity recompiles all other scripts.
- A script can access types defined in any other script.
- All scripts are compiled for all platforms.
Organizing your scripts into custom assemblies promotes modularity and reusability. It prevents them from being added to the default assemblies automatically, and limits which scripts they can access.

You might split up your code into multiple assemblies, as shown in the diagram above. Here, any changes to the code in Main cannot affect the code in Stuff. Similarly, because Library doesn’t depend on any other assemblies, you can easily reuse the code from Library in just about any other project.
Assemblies in .NET has general information about assemblies in C#. Refer to Assembly definitions in the Unity documentation for more information about defining your own assemblies in Unity.
Ever catch yourself repeating the same changes when you create a new script? Do you instinctively add a namespace or delete the update event function? Save yourself a few keystrokes and create consistency across the team by setting up the script template at your preferred starting point.
Every time you create a new script or shader, Unity uses a template stored in
%EDITOR_PATH%\Data\Resources\ScriptTemplates:
- Windows: C:\Program Files\Unity\Editor\Data\Resources\ScriptTemplates
- Mac: /Applications/Hub/Editor/[version]/Unity/Unity.app/Contents/Resources/ScriptTemplates
The default MonoBehaviour template is this one:
81-C# Script-NewBehaviourScript.cs.txt
There are also templates for shaders, other behavior scripts, and assembly definitions.
For project-specific script templates, create an Assets/ScriptTemplates folder, then copy the script templates into this folder to override the defaults.
You can also modify the default script templates directly for all projects, but make sure that you backup the originals before making any changes.
The original 81-C# Script-NewBehaviourScript.cs.txt file looks like this:
using System.Collections;
using System.Collections.Generic;
using UnityEngine;

#ROOTNAMESPACEBEGIN#
public class #SCRIPTNAME# : MonoBehaviour
{
    // Start is called before the first frame update
    void Start()
    {
        #NOTRIM#
    }

    // Update is called once per frame
    void Update()
    {
        #NOTRIM#
    }
}
#ROOTNAMESPACEEND#
It’s helpful to keep these two keywords in mind:
- #SCRIPTNAME# indicates the file name entered or the default file name (for example, NewBehaviourScript).
- #NOTRIM# ensures that the brackets contain a line of whitespace.
Relaunch the Unity Editor, and your changes should appear every time you create a custom MonoBehaviour.
You can also modify the other templates in a similar fashion. Remember to keep a copy of your original, plus modifications, somewhere outside the Unity project for safekeeping.

Unity has a variety of attributes that can be placed above a class, property, or function to indicate special behavior. C# contains attribute names within square brackets.
Here are some common attributes you can add to your scripts:
This is just a small sample of the numerous attributes you can work with. Do you want torename your variables without losing their values? Or invoke some logic without an empty GameObject? Check out the Scripting API for a complete list of attributes to see what’s possible.
You can even create your own PropertyAttribute to define custom attributes for your script variables
One of Unity’s most powerful features is its extensible Editor. Use the UI Toolkit package or the IMGUI mode to create Editor UIs, such as custom windows and inspectors.
UI Toolkit has a workflow similar to standard web development. Use its HTML- and XML-inspired markup language, UXML, to define user interfaces and reusable UI templates. Then, apply Unity Style Sheets (USS) to modify the visual style and behaviors of your UIs.
Alternatively, you can use immediate mode, IMGUI, as mentioned above. First derive from the Editor base class, then use the CustomEditor attribute.
Either solution can make a custom inspector.
A custom Editor modifies how the MyPlayer script appears in the Inspector:

See Creating user interfaces (UI) for more on how to implement custom Editor scripts using either UI Toolkit or IMGUI. For a quick introduction to UI Toolkit, watch the Getting started with Editor scripting tutorial.
The Addressable Asset System simplifies how you manage the assets that make up your game. Any asset, including Scenes, Prefabs, text assets, and so on, can be marked as “addressable” and given a unique name. You can call this alias from anywhere.
Adding this extra level of abstraction between the game and its assets can streamline certain tasks, such as creating a separate downloadable content pack. This system also facilitates referencing those asset packs, whether they’re local or remote.
To begin, install the Addressables package from the Package Manager, and add some basic settings to the project. Each asset or Prefab in the project should have the option to be made “addressable.” Check the option under an asset’s name in the Inspector to assign it a default unique address.

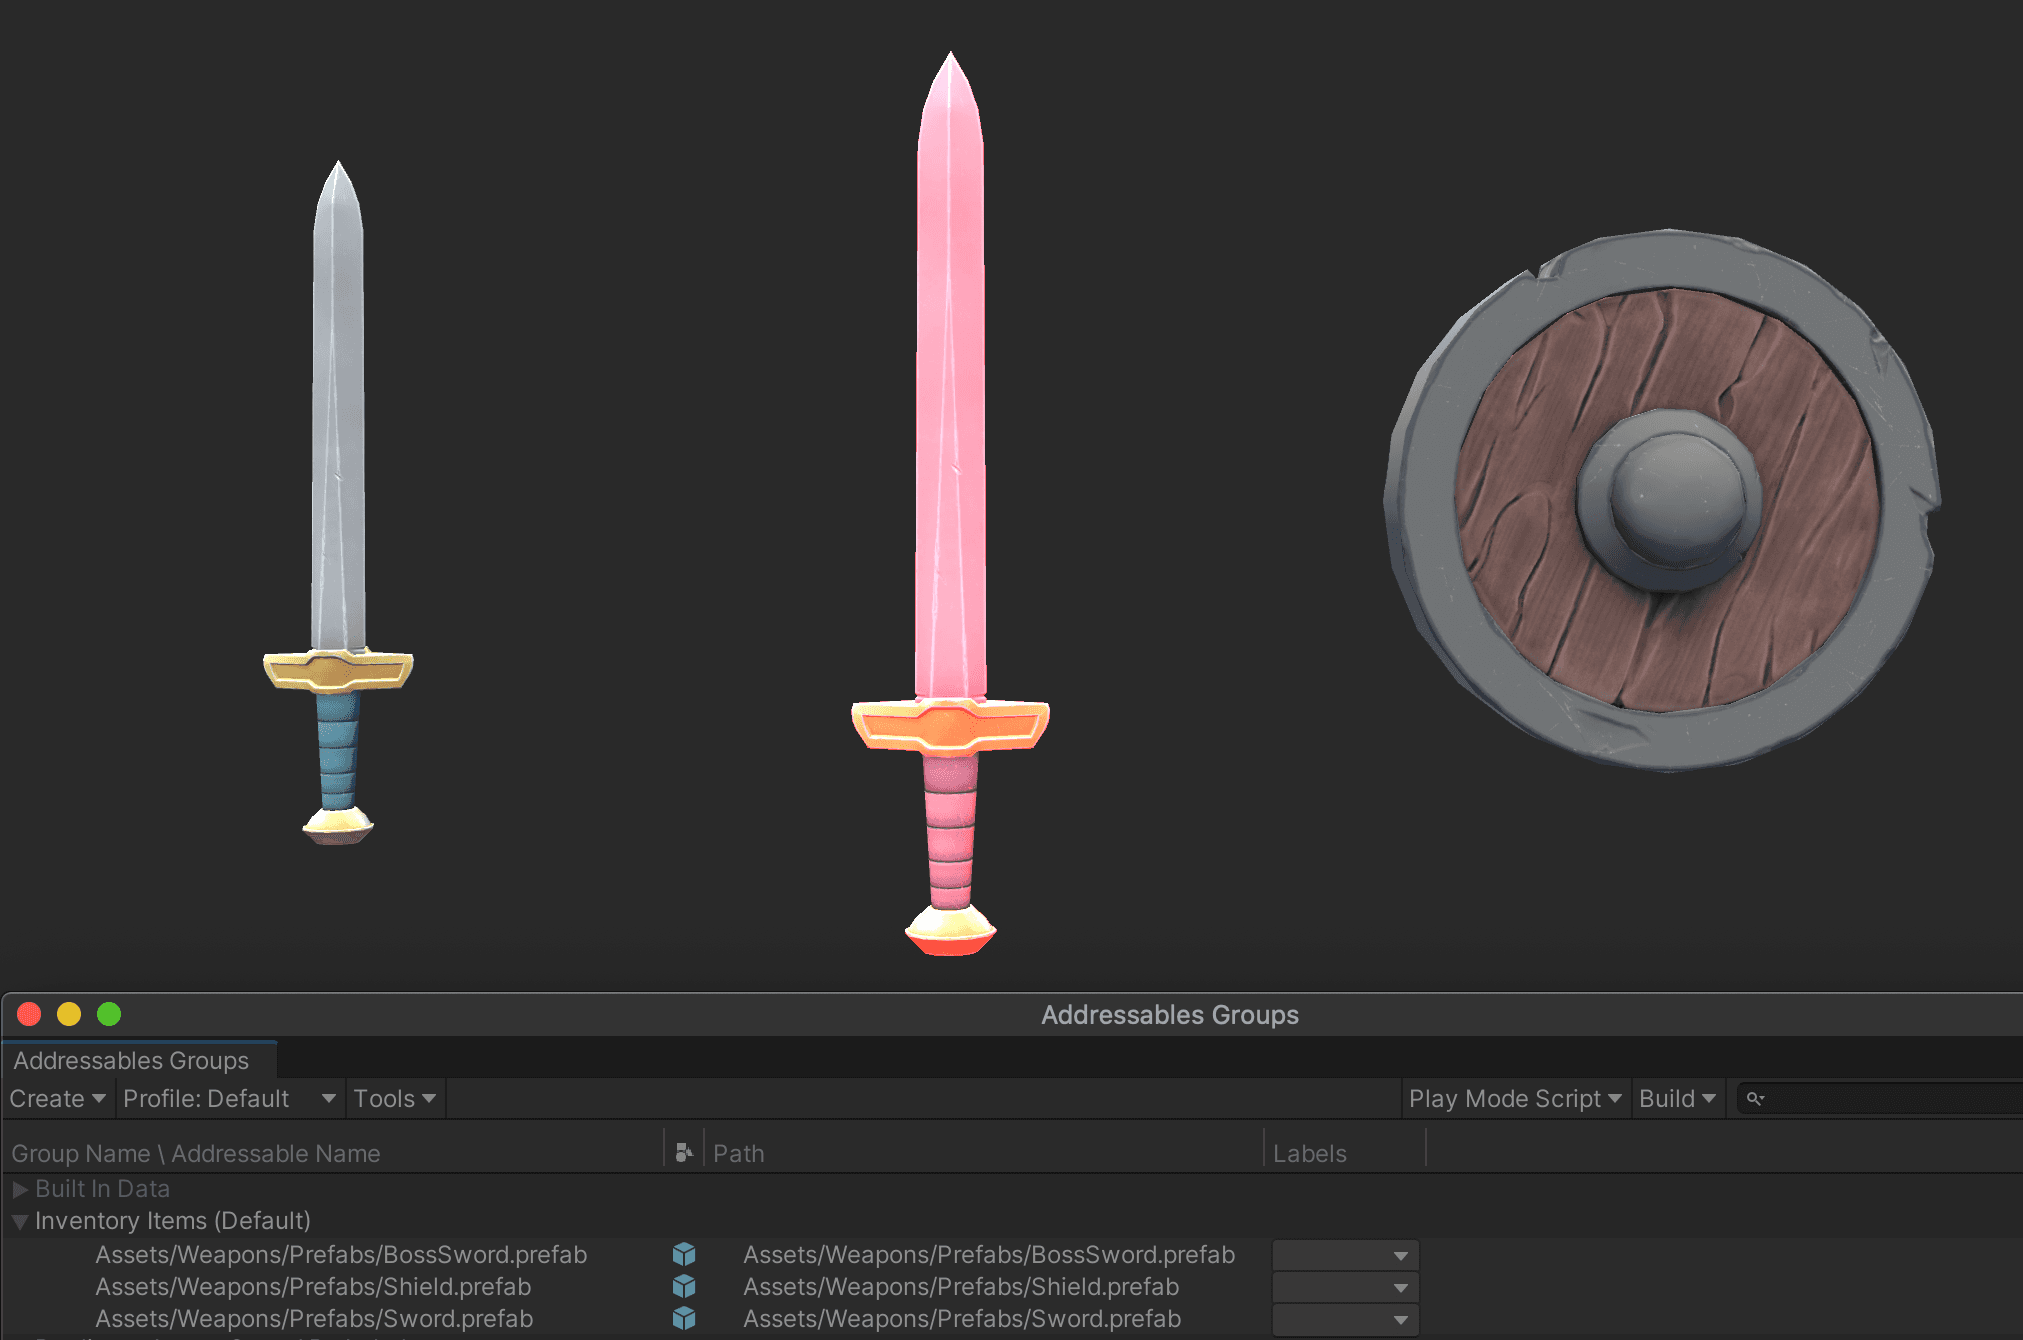
Once marked, the corresponding assets will appear in the Window > Asset Management > Addressables > Groups window.

For convenience, you can either rename each address in the asset’s individual Address field, or simplify them all at once.

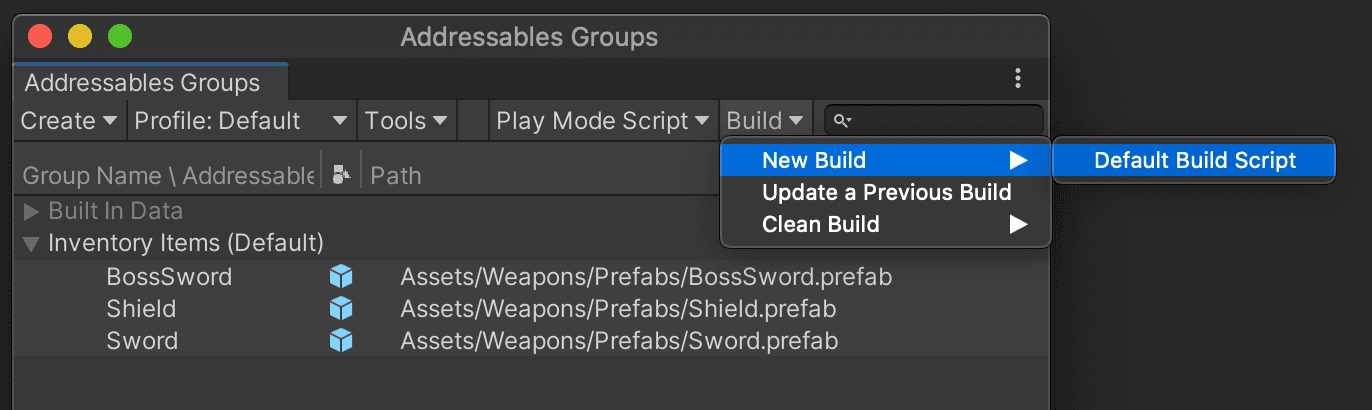
Bundle these assets to host them on a server elsewhere, or distribute them locally within your project. Wherever each asset resides, the system can locate them using the Addressable Name string.
You can now use your Addressable assets through the Addressables API.
It’s worth noting that, without Addressables, you’d have to complete the following to instantiate a Prefab in your Scene:
public GameObject prefabToCreate;

public void CreatePrefab()
{
    GameObject.Instantiate(prefabToCreate);
}
view rawgistfile1.txt hosted with ❤ by GitHub
The disadvantage here is that any referenced Prefab (like prefabToCreate) would load into memory, even if the Scene doesn’t need it.
Using Addressables, do this instead:
public string prefabByAddress;
…
public void CreatePrefabWithAddress()
{
    Addressables.Instantiate(prefabByAddress, instantiationParameters, bool);
}
This loads the asset by its address string, meaning that the Prefab does not load into memory until it’s needed (when we invoke Adressables.Instantiate inside CreatedPrefabWithAddress). Additionally, you can use Addressables for high-level reference counting, to automatically unload bundles and their associated assets when they’re no longer in use.
Tales from the optimization trenches: Saving memory with Addressables shows an example of how to organize your Addressables Groups so that they are more memory efficient. Meanwhile, the Addressables: Introduction to concepts tutorial offers a quick overview of how the Addressable Asset System can work in your project.
If you’re operating a live game, then you might want to consider using Unity’s Cloud Content Delivery (CCD) solution with Addressables. The Addressables system stores and catalogs game assets so that they can be located and called automatically. CCD then pushes those assets directly to your players, completely separate from your code. This reduces your build size and eliminates the need to have your players download and install new game versions every time you make an update. To learn more, read this blog on the integration between Addressables and Cloud Content Delivery.
The Platform Dependent Compilation feature allows you to partition your scripts to compile and execute code for a specifically targeted platform.
This example makes use of the existing platform #define directives with the #if compiler directive:
using UnityEngine;
using System.Collections;

public class PlatformDefines : MonoBehaviour
{
  void Start ()
  {
    #if UNITY_EDITOR
      Debug.Log("Unity Editor");
    #endif

    #if UNITY_IOS
      Debug.Log("Iphone");
    #endif

    #if UNITY_STANDALONE_OSX
      Debug.Log("Stand Alone OSX");
    #endif

    #if UNITY_STANDALONE_WIN
      Debug.Log("Stand Alone Windows");
    #endif

  }
}
Use the DEVELOPMENT_BUILD #define to identify whether your script is running in a player that was built with the Development Build option.
You can compile selectively for particular Unity versions and/or scripting backends, and even supply your own custom #define directives when testing in the Editor. Open the Other Settings panel, part of the Player settings, and navigate to Scripting Define Symbols.

See Platform Dependent Compilation for more information on Unity’s preprocessor directives.
A ScriptableObject is a data container that saves large amounts of data, seperate from class instances. ScriptableObjects avoid copying values, which can reduce your project’s memory usage. Check out the full e-book for some examples of how to use ScriptableObjects. Otherwise, peruse the ScriptableObject documentation for further details on using ScriptableObjects in your application.
Looking for even more? Watch Better data with ScriptablesObjects in Unity for a quick introduction, and see how they can help with Scene management in Achieve better Scene workflow with ScriptableObjects.
Optimization tip
We recommend binary serialization formats such as MessagePack or Protocol Buffers for saved data, rather than text-based ones, such as JSON or XML. In project reviews, these binary serialization formats reduce the memory and performance issues associated with the latter.
Unity offers support for the following integrated development environments (IDEs):
- Visual Studio: Default IDE on Windows and macOS
- Visual Studio Code: Windows, macOS, Linux
- JetBrains Rider: Windows, macOS, Linux
IDE integrations for all three of these environments appear as packages in the Package Manager.

When you install Unity on Windows and macOS, Visual Studio is installed by default. If you want to use another IDE, simply browse for the editor in Unity > Preferences > External Tools > External Script Editor.
Rideris built on top of ReSharper and includes most of its features. It supports C# debugging on the .NET 4.6 scripting runtime in Unity (C# 8.0). For more information, see JetBrains’ documentation on Rider for Unity.
VS Code is a free, streamlined code editor with support for debugging, task running, and version control. Note that Unity requires Mono (macOS and Linux), Visual Studio Code C#, and Visual Studio Code Debugger for Unity (not officially supported) when using VS Code.
Each IDE has its own merits. See Integrated development environment (IDE) support for more information on choosing the right IDE for your needs.
Take a look at the e-book for a list of shortcuts that can benefit your project, and watch Visual Studio tips and tricks to boost your productivity for more workflow improvements with Visual Studio.
Interested in exploring JetBrains Rider? Check out Fast C# scripting in Unity with JetBrains Rider, or these tips on using JetBrains Rider as your code editor.
The Unity Debugger allows you to debug your C# code while the Unity Entity is in Play mode. You can attach breakpoints within the code editor to inspect the state of your script code and its current variables at runtime.
Go to the bottom right of the Unity Editor Status Bar to set the Code Optimization mode to Debug.You can also change this mode on startup at Edit > Preferences > General > Code Optimization On Startup.

In the code editor, set a breakpoint where you want the Debugger to pause execution. Simply click over the left margin/gutter area where you want to toggle a breakpoint (or right-click there, to see the context menu for other options). A red circle will appear next to the line number of the highlighted line (see image below).


Select Attach to Unity in your code editor, then run the project in the Unity Editor.

In Play mode, the application will pause at the breakpoint, giving you time to inspect variables and investigate any unintended behavior.

As shown above, you can inspect the variables when debugging by watching the list build up, one step at a time, during execution.

Use the Continue Execution, Step Over, Step Into, and Step Out controls to navigate the control flow.

Press Stop to cease debugging and resume execution in the Editor.
You can debug script code in a Unity Player as well. Just make sure that Development Build and Script Debugging are both enabled in the File > Build Settings before you build the Player. Check Wait for Managed Debugger to wait for the Debugger before the Player executes any script code. To attach the code editor to the Unity Player, select the IP address (or machine name) and port of your Player. Then proceed normally in Visual Studio with the Attach To Unity option.
Unity provides a Debug class to help you visualize information in the Editor while it’s running. Learn how to print messages or warnings in the Console window, draw visualization lines in the Scene and Game views, and pause Play mode in the Editor from script. Here’s a few more tips to help you get going:
1. Pause execution with Debug.Break. This is useful for checking certain values in the Inspector when the application is difficult to pause manually.
2. You should be familiar with Debug.Log, Debug.LogWarning, and Debug.LogError for printing Console messages. Also handy is Debug.Assert, which asserts a condition and logs an error upon failure. Note, however, that it only works if the UNITY_ASSERTIONS symbol is defined. Log messages, warnings, and errors in the Console.

3. When using Debug.Log, you can pass in an object as the context. If you click on the message in the Console, Unity will highlight the GameObject in the Hierarchy window.
4. Use Rich Text to mark up your Debug.Log statements. This can help you enhance error reports in the Console.
5. Unity does not automatically strip the Debug logging APIs from non-development builds. Wrap your Debug Log calls in custom methods and decorate them with the [Conditional] attribute. To compile out the Debug Logs all at once, remove the corresponding Scripting Define Symbol from the Player Settings. This is identical to wrapping them in #if… #endif preprocessor blocks. See this General optimizations guide for more details.
6. Troubleshooting physics? Debug.DrawLine and Debug.DrawRay can help you visualize raycasting.

1. If you only want code to run while Development Build is enabled, see if Debug.isDebugBuild returns true.
2. Use Application.SetStackTraceLogType, or the equivalent checkboxes in Player Settings, to decide which kind of log messages should include stack traces. Stack traces can be useful, but they are slow and generate garbage.

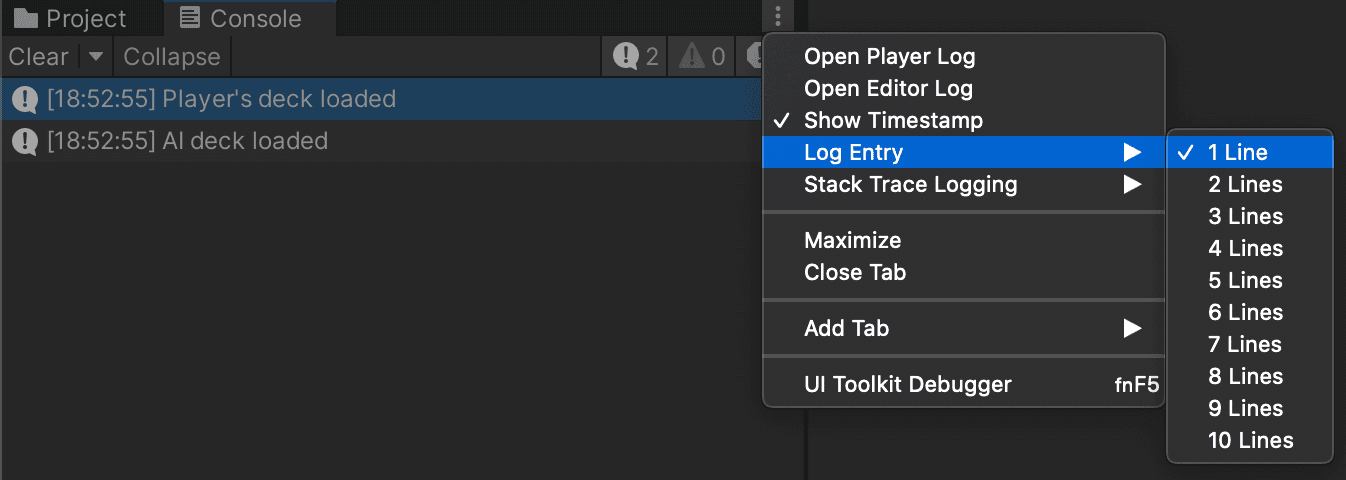
By default, the Console Log Entry shows two lines. For improved readability, you can streamline them to just one line. See how below.
Alternatively, you can use more lines for longer entries.
When Unity compiles, the icon in the lower right corner can be difficult to see. Use this custom Editor script to call EditorApplication.isCompiling. This creates a floating window to make the compiler status more visible.
Launch the MenuItem to initialize the window. You can even modify its appearance with a new GUIStyle to suit your preferences.
using UnityEditor;
using UnityEngine;

public class CustomCompileWindow : EditorWindow
{
    [MenuItem("Examples/CustomCompileWindow")]
    static void Init()
    {
        EditorWindow window = GetWindowWithRect(typeof(CustomCompileWindow), new Rect(0, 0, 200, 200));
        window.Show();
    }
   void OnGUI()
    {
        EditorGUILayout.LabelField("Compiling:", EditorApplication.isCompiling ? "Yes" : "No");
       this.Repaint();
    }
}Unity has integrations with two version control systems (VCS): Perforce and Plastic SCM. To set the Perforce or Plastic SCM servers for your Unity project, go to Project Settings > Editor. Configure the server (and your user credentials for Perforce) under Version Control.

Teams on Unity can use Plastic SCM Cloud Edition for free, for up to 5 GB of storage and a maximum of three users. By using Plastic SCM for Unity, you can sync your changes with your teammates’ work and consult your project history without ever leaving Unity. Read about some recent updates to Plastic SCM here.
You can also use an external system, such as Git, including Git LFS (Large File Support) for more efficient version control of larger assets, like graphics and sound resources. For the added convenience of working with the GitHub hosting service, install the GitHub for Unity plug-in. This open source extension allows you to view your project history, experiment in branches, commit your changes, and push your code to GitHub, all within Unity.
Unity maintains a .gitignore file. This can help you decide what should and shouldn’t go into the Git repository, and then enforce those rules.

Unity Teams is another option for streamlining your workflows, as it allows you to store your entire project in the cloud. This means that it’s backed up and accessible anywhere, making it that much easier to save, share, and sync your Unity projects with anyone.
Check out the first two blog posts in this series, 5 ways to speed up your workflows in the Editor and Speed up your artist workflows. You can also download the free 70+ tips to increase productivity with Unity 2020 LTS guide, which compiles all the tips in one practical e-book.
As always, please inform us of any additional topics or features you’d like to hear about in the comments, and feel free to share your own productivity tips with the community.