Speed up and improve QA testing with Unity’s Debug class
Read on to learn how to improve your QA and debugging process with Unity’s Debug class.
While you may already be familiar with the Debug.Log function, the Unity Debug class supports many other handy functions that can help you speed up your testing and debugging. This page explains how to use the Debug class for gizmo visualization in the Scene and Game views, to pause Play mode in the Editor from script, and more tips.
Errors, warnings, and messages
If you’re experienced with Unity, then you’ve probably used the Console window to display errors, warnings, and other messages generated by the Editor. You’ve also certainly printed your own messages to the Console as well using the Debug class.
But you’re not limited to only the Debug.Log Message. When you create outputting strings to the Console window, you can specify one of three types (error, warning, and message), each with their own icon type.
The three variants are:
- Debug.Log (“This is a log message.”)
- Debug.LogWarning (“This is a warning message.”)
- Debug.LogError (“This is an error message.”)
You can use the Console window to filter the messages based on your preferences. You can also take advantage of having the Error Pause enabled in the Console window, since any errors that you write to the Console via the Debug class will cause Unity’s Play mode to pause.
Everything outputted to the Console window, either by Unity or your own messages, is added to a Log File that you can reference to see where problems occurred in your application. Each operating system stores the log files in different locations, so check documentation to see specifications for each system.

Configure your stack trace
When an error or exception is thrown, the Console window displays the stack trace along with the error message to help you understand how the error occurred and where it originated. While Debug.Log allows you to send a message to the Console, you can also configure the level of detail shown in the stack trace.
By default, the output in the Console links to the line of code that generated the message, making it easy to identify the line, method, or sequence of function calls that caused the entry to appear.
If the script doesn’t open in your chosen IDE go to File > Preferences > External Tools and select the “External Script Editor” from the dropdown.
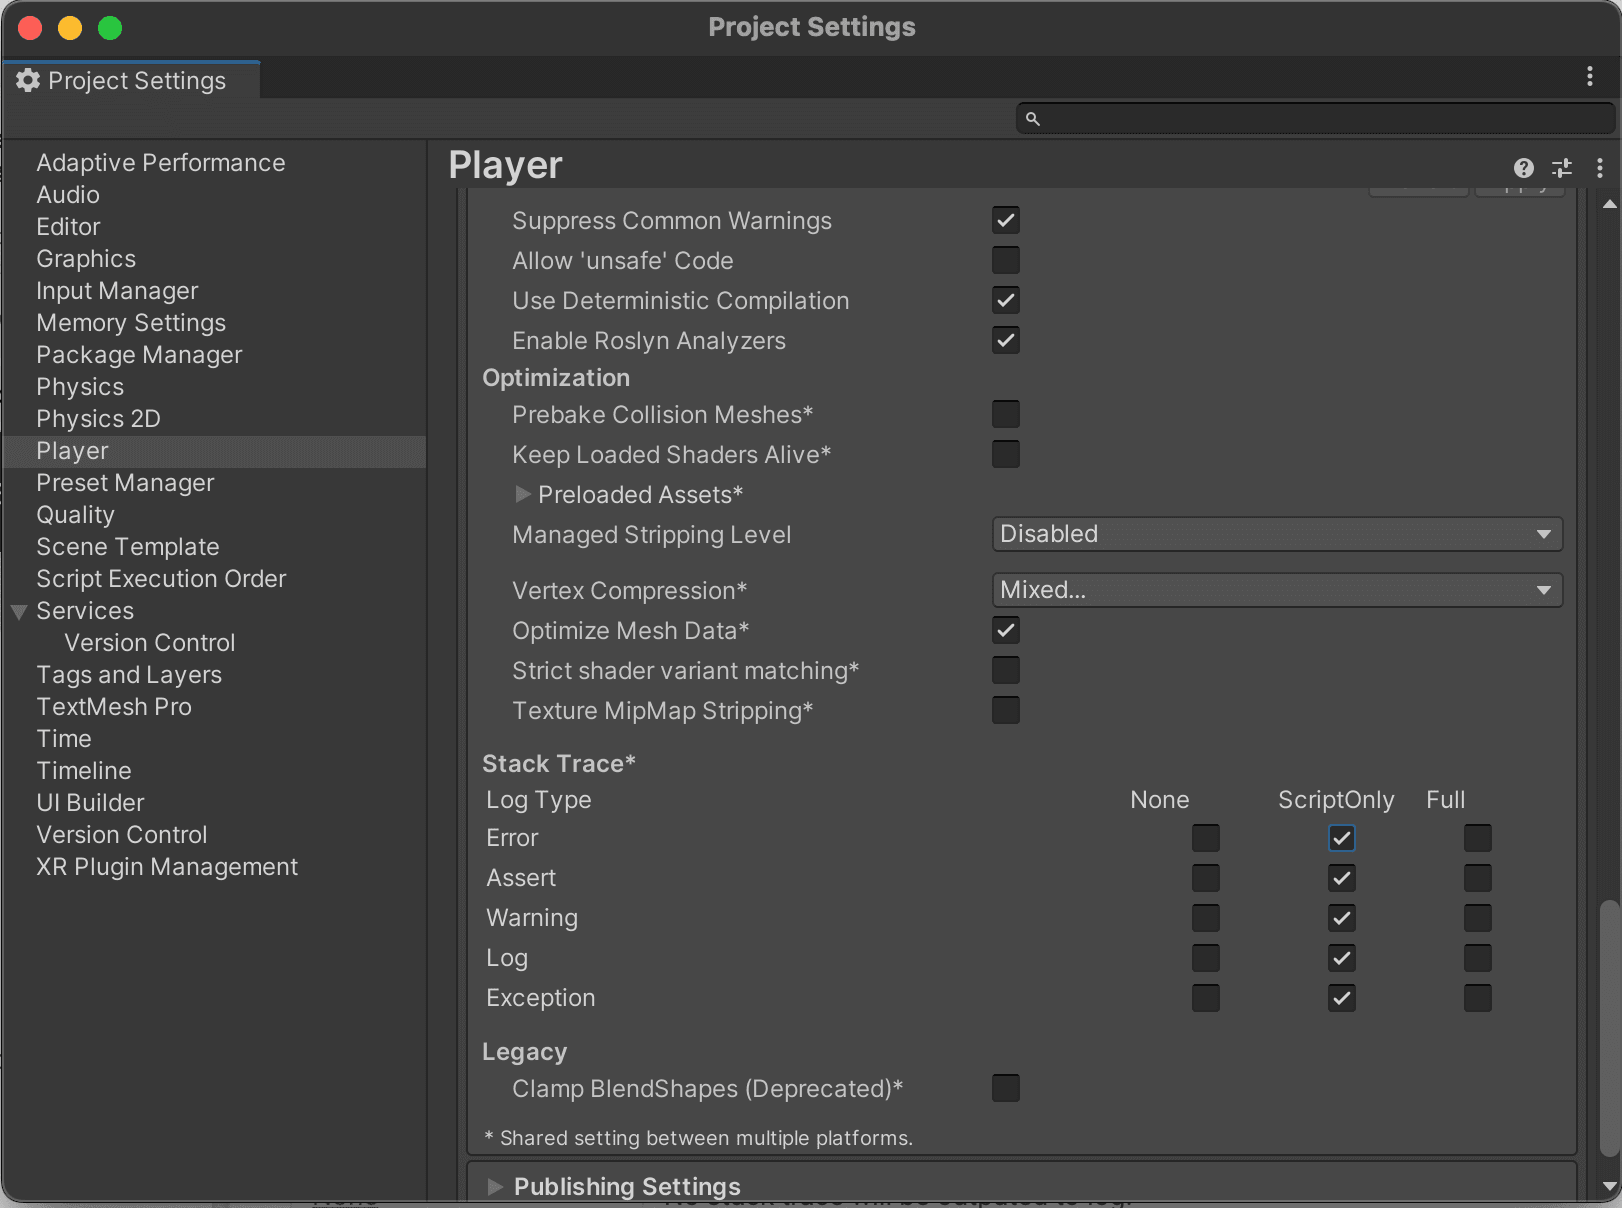
You can configure the information shown in the stack trace via File > Build Settings… > Player Settings … > Other Settings in the Editor.
The following options are available for each log type:
- None: No stack trace will be outputted to log.
- ScriptOnly: Only managed stack trace will be outputted. This is the default option if you haven’t changed the settings.
- Full: Native and managed stack trace will be logged.
Make use of the search feature in the Console if your log becomes crowded. As you type a search term, the Console filters messages to display only those that contain matching text.
Control how many lines of each entry are visible in the list by clicking the Console menu button and selecting Log Entry > [X] Lines from the menu, where [X] is the number of lines to display for each entry.
Use LogFormat to display variables
The String.Format method in C# allows you to create a string with embedded formatted variable data. The Debug class has Debug.LogFormat, which uses the same syntax.
The first parameter is the formatted message string. By including an index value in curly braces, this will be replaced by parameter index-1 using its ToString method, if it exists, or the System string conversion. In the code example above, line 14, {0} will be replaced by origin.ToString().
A more complex example is this:
Debug.LogFormat("At Start transform.position={0}, transform.rotation={1}", transform.position, transform.rotation);
{0} will be replaced by parameter 1, transform.position and {1} will be replaced by parameter 2, transform.rotation. In each case the ToString method of the Vector3 and Quaternion properties will be used. The result will look like this:
“The origin is (0.00, 0.00, 0.00)
UnityEngine.Debug:LogFormat (string,object[])”
Additional parameters
You can also provide an optional second parameter to these log methods to indicate that the message is associated with a particular GameObject:
Debug.LogWarning("I come in peace!", this.gameObject);
When you display formatted variable data there are warning and error versions of Debug.LogFormat:
- Debug.LogWarningFormat("The value of Cube.position.x is {0:0.00}", transform.position.x)
- Debug.LogErrorFormat("The value of Cube.position.x is {0:0.00}", transform.position.x)
If you send a float value to the Console using Debug.Logformat, the default display will show six numbers following the decimal point. You can control this behavior with a custom numeric formatting string.
Debug.LogFormat("pi = {0:0.00}", Mathf.PI);
By using a colon, the formatting string 0.00 will display the integer part of a value, the decimal separator, and two numbers following the separator. The last number will be rounded based on the next value using the familiar method 4 to the floor, 5 to the sky.
In this example, the output would be: pi = 3.14
How to run automated tests for your games with the Unity Test Framework
Using Debug.Assert
Debug.Assert() is similar to Debug.Log() method, but instead of logging a message to the console, it tests a condition and displays an error message if the condition is false. It’s used to validate assumptions and catch errors during development.
Assertions are a great way to check that your program doesn’t enter an unexpected state. They are like embedding a Log inside an if statement. When you are working on a method that relies on a class property being assigned, an assertion can help you track down errors.
When Debug.Assert() is called, it takes two parameters: a condition to test and an optional message to display if the condition is false. If the condition is true, nothing happens and the program continues to run. If the condition is false, the program stops running and an error message is displayed in the Editor.
void SetColor(Color color)
{
Debug.Assert(material != null, "ChangeColor: material not assigned");
material.SetColor("_Color", color);
}
If you call SetColor and material is not assigned, ‘SetColor: material not assigned’ will be displayed in the Console.
Using Debug.Break
Debug.Break() is a method provided by Unity’s Debug class that is used to pause the execution of your game and enter the debugger at the current point in your code. It allows you to inspect the state of your game and step through your code line by line to find and fix bugs.
When Debug.Break() is called, it halts the execution of your game and opens the Debugger window. This allows you to examine the state of your game and debug your code as needed. You can use the debugger to step through your code, set breakpoints, and inspect variables and objects in memory.
For example, you might want to stop a game when an NPC is within target distance of the player character. When the game breaks, you can examine its state in the Inspector:
float dist = Vector3.Distance(transform.position, npc.position);
if ( dist < 5) Debug.Break();

Debug.DrawLine
Debug.DrawLine and Debug.DrawRay are two methods provided by Unity’s Debug class that are used for visual debugging. They’re useful to test and visualize physics-related code, such as collisions and raycasts. Both allow you to draw a colored line that is visible in both the Game and Scene views. For example, you can use Debug.DrawRay to visualize the trajectory of a bullet or the path of a laser beam and use Debug.DrawLine to visualize the bounds of a collider or the movement of an object.
Debug.DrawLine is used to draw a straight line between two points in the scene:
Debug.DrawLine(transform.position, target.position, Color.white, 0, false);
It takes two to five parameters: a starting point, ending point, and an optional color. For example, the following code would draw a white line between the points start and end:
public static void DrawLine(Vector3 start, Vector3 end, Color color = Color.white, float duration = 0.0f, bool depthTest = true);
Parameters
- start: Point in world space where the line should start
- end: Point in world space where the line should end
- color: The line color
- duration: Time in seconds to display the line. 0 displays line for single frame
- depthTest: Should the line be hidden by foreground objects
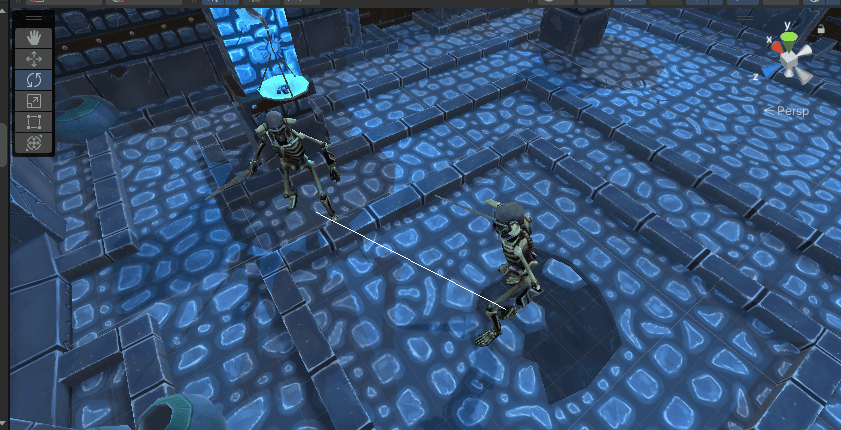
In the code example, the Update method of a MonoBehaviour script attached to the Skeleton GameObject results in the image seen above. The line is only visible in Game view if gizmos are enabled. Click the Gizmo button at the top right of the Game view pane to enable them. The line is also visible in Scene view.
Debug.DrawRay
The alternative to DrawLine is DrawRay. Debug.DrawRay is used to draw a ray in the scene, starting from a specified origin and extending in a specified direction. By default, it’s an infinite ray. When the ray drawn by Debug.DrawRay() hits a collider, it will stop at the point of intersection and won’t continue any further. This behavior is the same as that of a raycast in Unity, used to detect collisions between objects in a scene.
Here the second parameter defines a direction and length of the line. The line will be drawn from start to start + dir:
public static void DrawRay(Vector3 start, Vector3 dir, Color color = Color.white, float duration = 0.0f, bool depthTest = true);
The parameters in the code example are:
- start: Point in world space where the line should start
- dir: Direction and length in world space of the line
- color: The line color
- duration: Time in seconds to display the line; 0 displays line for single frame
- depthTest: Should the line be hidden by foreground objects
Here’s another code example:
Vector3 dir = transform.TransformDirection(Vector3.forward) * 3;Debug.DrawRay(transform.position, dir, Color.white, 0, false);
In this code example, the Update method of a MonoBehaviour script attached to the Skeleton GameObject results in the image above. A ray with a length can be useful for debugging proximity tests. Here, the ray length is 3 world units. If an attack should start at 3 units, then you have a great visual test of how long 3 units is in your scene.

Using Gizmos
Gizmos are a powerful tool for visual debugging in Unity. They allow you to draw simple 2D and 3D shapes, lines, and text in Scene view, making it easy to see and understand what is happening in your game world.
You can draw simple shapes and lines in the Scene view with just a few lines of code. This makes them an ideal tool for quickly prototyping and testing your game mechanics. They’re drawn in real-time, so you can see the results of your code changes immediately and make any necessary changes.
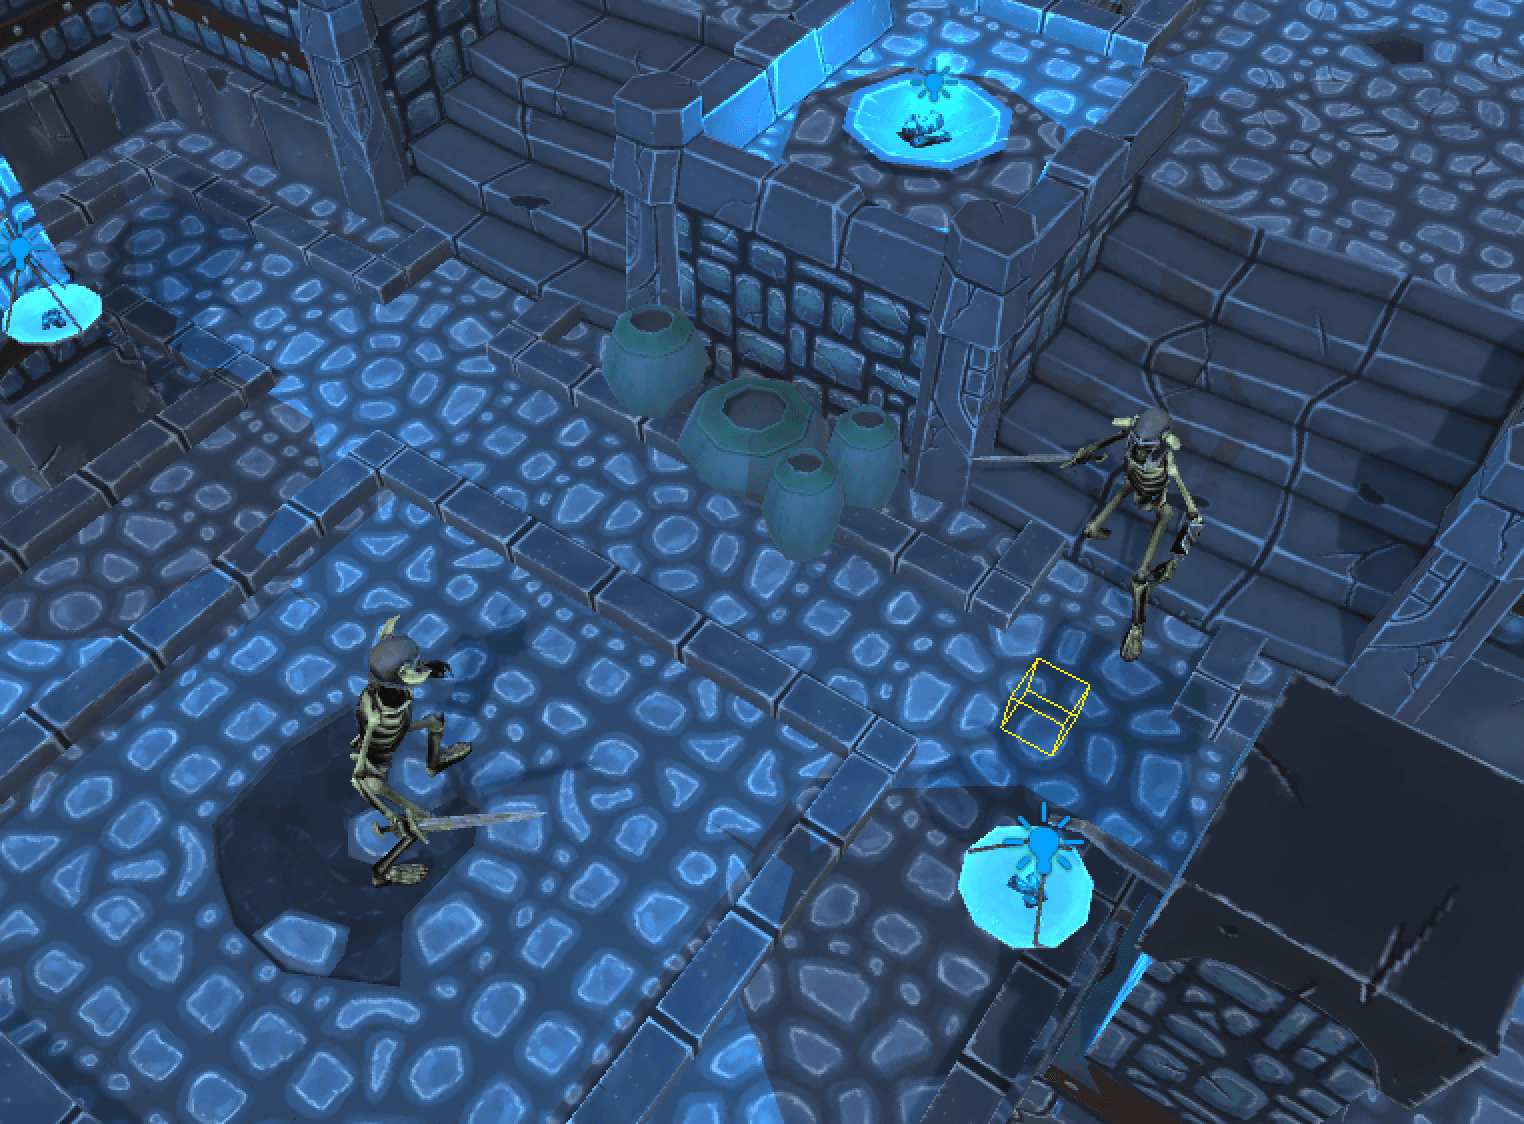
Gizmos indicate visually complex game mechanics that might be difficult to understand through code alone. For example, you can use Gizmos to draw a line showing the path of a projectile or to visualize the boundaries of a trigger zone, as seen in the image above.
Use gizmos to create visual aids that make it easier for other team members to understand your code and game mechanics.
Gizmos have little impact on performance, so you can use them freely without slowing down performance.
The gizmo icon is in the top-right corner of the Scene and Game views. To add a custom gizmo, you need to add a script that includes a OnDrawGizmos callback, as the code example below shows. This script will draw a wireframe cube positioned 3 world units forward of the GameObject’s position. The size of the cube is defined by the class property vsize of the type Vector3: public Vector3 vsize = new Vector3(1f, 1f, 1f);
void OnDrawGizmos()
{
// Draw a yellow sphere at the transform's position
Gizmos.color = Color.yellow;
Vector3 position = transform.position + transform.TransformDirection(Vector3.forward) * 3;
Gizmos.DrawWireCube(position, vsize);
}
Control the visibility by clicking the gizmos dropdown. Any scripts with an OnDrawGizmos callback will be listed.
Review documentation to learn more about other useful methods with the Gizmo class.
Throwing exceptions
Throwing an exception is a technique used in programming to indicate that an error or exceptional situation has occurred during the execution of a program. You can use this method to stop the thread from executing further to prevent further damage.
In Unity, throwing an exception is used in the same way as in other programming languages.
If an exception is thrown and not caught and handled in the code, the program execution will usually stop and you will be thrown out of the app and back to the operating system. In Unity, the program execution is immediately halted and the runtime environment looks for a “catch” block that can handle the exception. If no catch block is found, the program will terminate and the exception will be logged to the Console.
Throwing exceptions can be helpful since this allows you to separate error-handling logic from the rest of your program logic, which can contribute to writing cleaner code. By throwing exceptions, you can signal to the caller that something went wrong without having to rely on return values or global state to communicate the error.
To throw an exception in Unity, you can use the throw keyword followed by an exception object. Here’s an example:
if (target == null)
{
throw new System.NullReferenceException("target not set!");
}
When you run your code in the Editor, it catches the thrown errors and does a Debug.LogError() instead of crashing Unity or the app.
Using exceptions in Unity allows you to catch errors early. It can also make debugging easier by providing you with more information about where errors occur and what caused them.

More resources
Learn much more about testing, debugging, and improving the performance of your Unity project in these articles:
- How to debug game code with Roslyn Analyzers
- How to run automated tests for your games with the Unity Test Framework
- Speed up your debugging workflow with Microsoft Visual Studio Code
- How to debug your code with Microsoft Visual Studio 2022
- Testing and quality assurance tips for Unity projects
Delve into advanced best practices and instructions for Unity developers with these e-books:
- Ultimate guide to profiling Unity games
- Optimize your game performance for mobile
- Optimize your console and PC game performance
Find many more advanced resources in the Unity best practices hub.