Programmer tools
What’s new in 2020.1
Discover some of the major updates relevant to programmers in Unity 2020.1. For full details, check out the release notes.
Profiling tools improvements
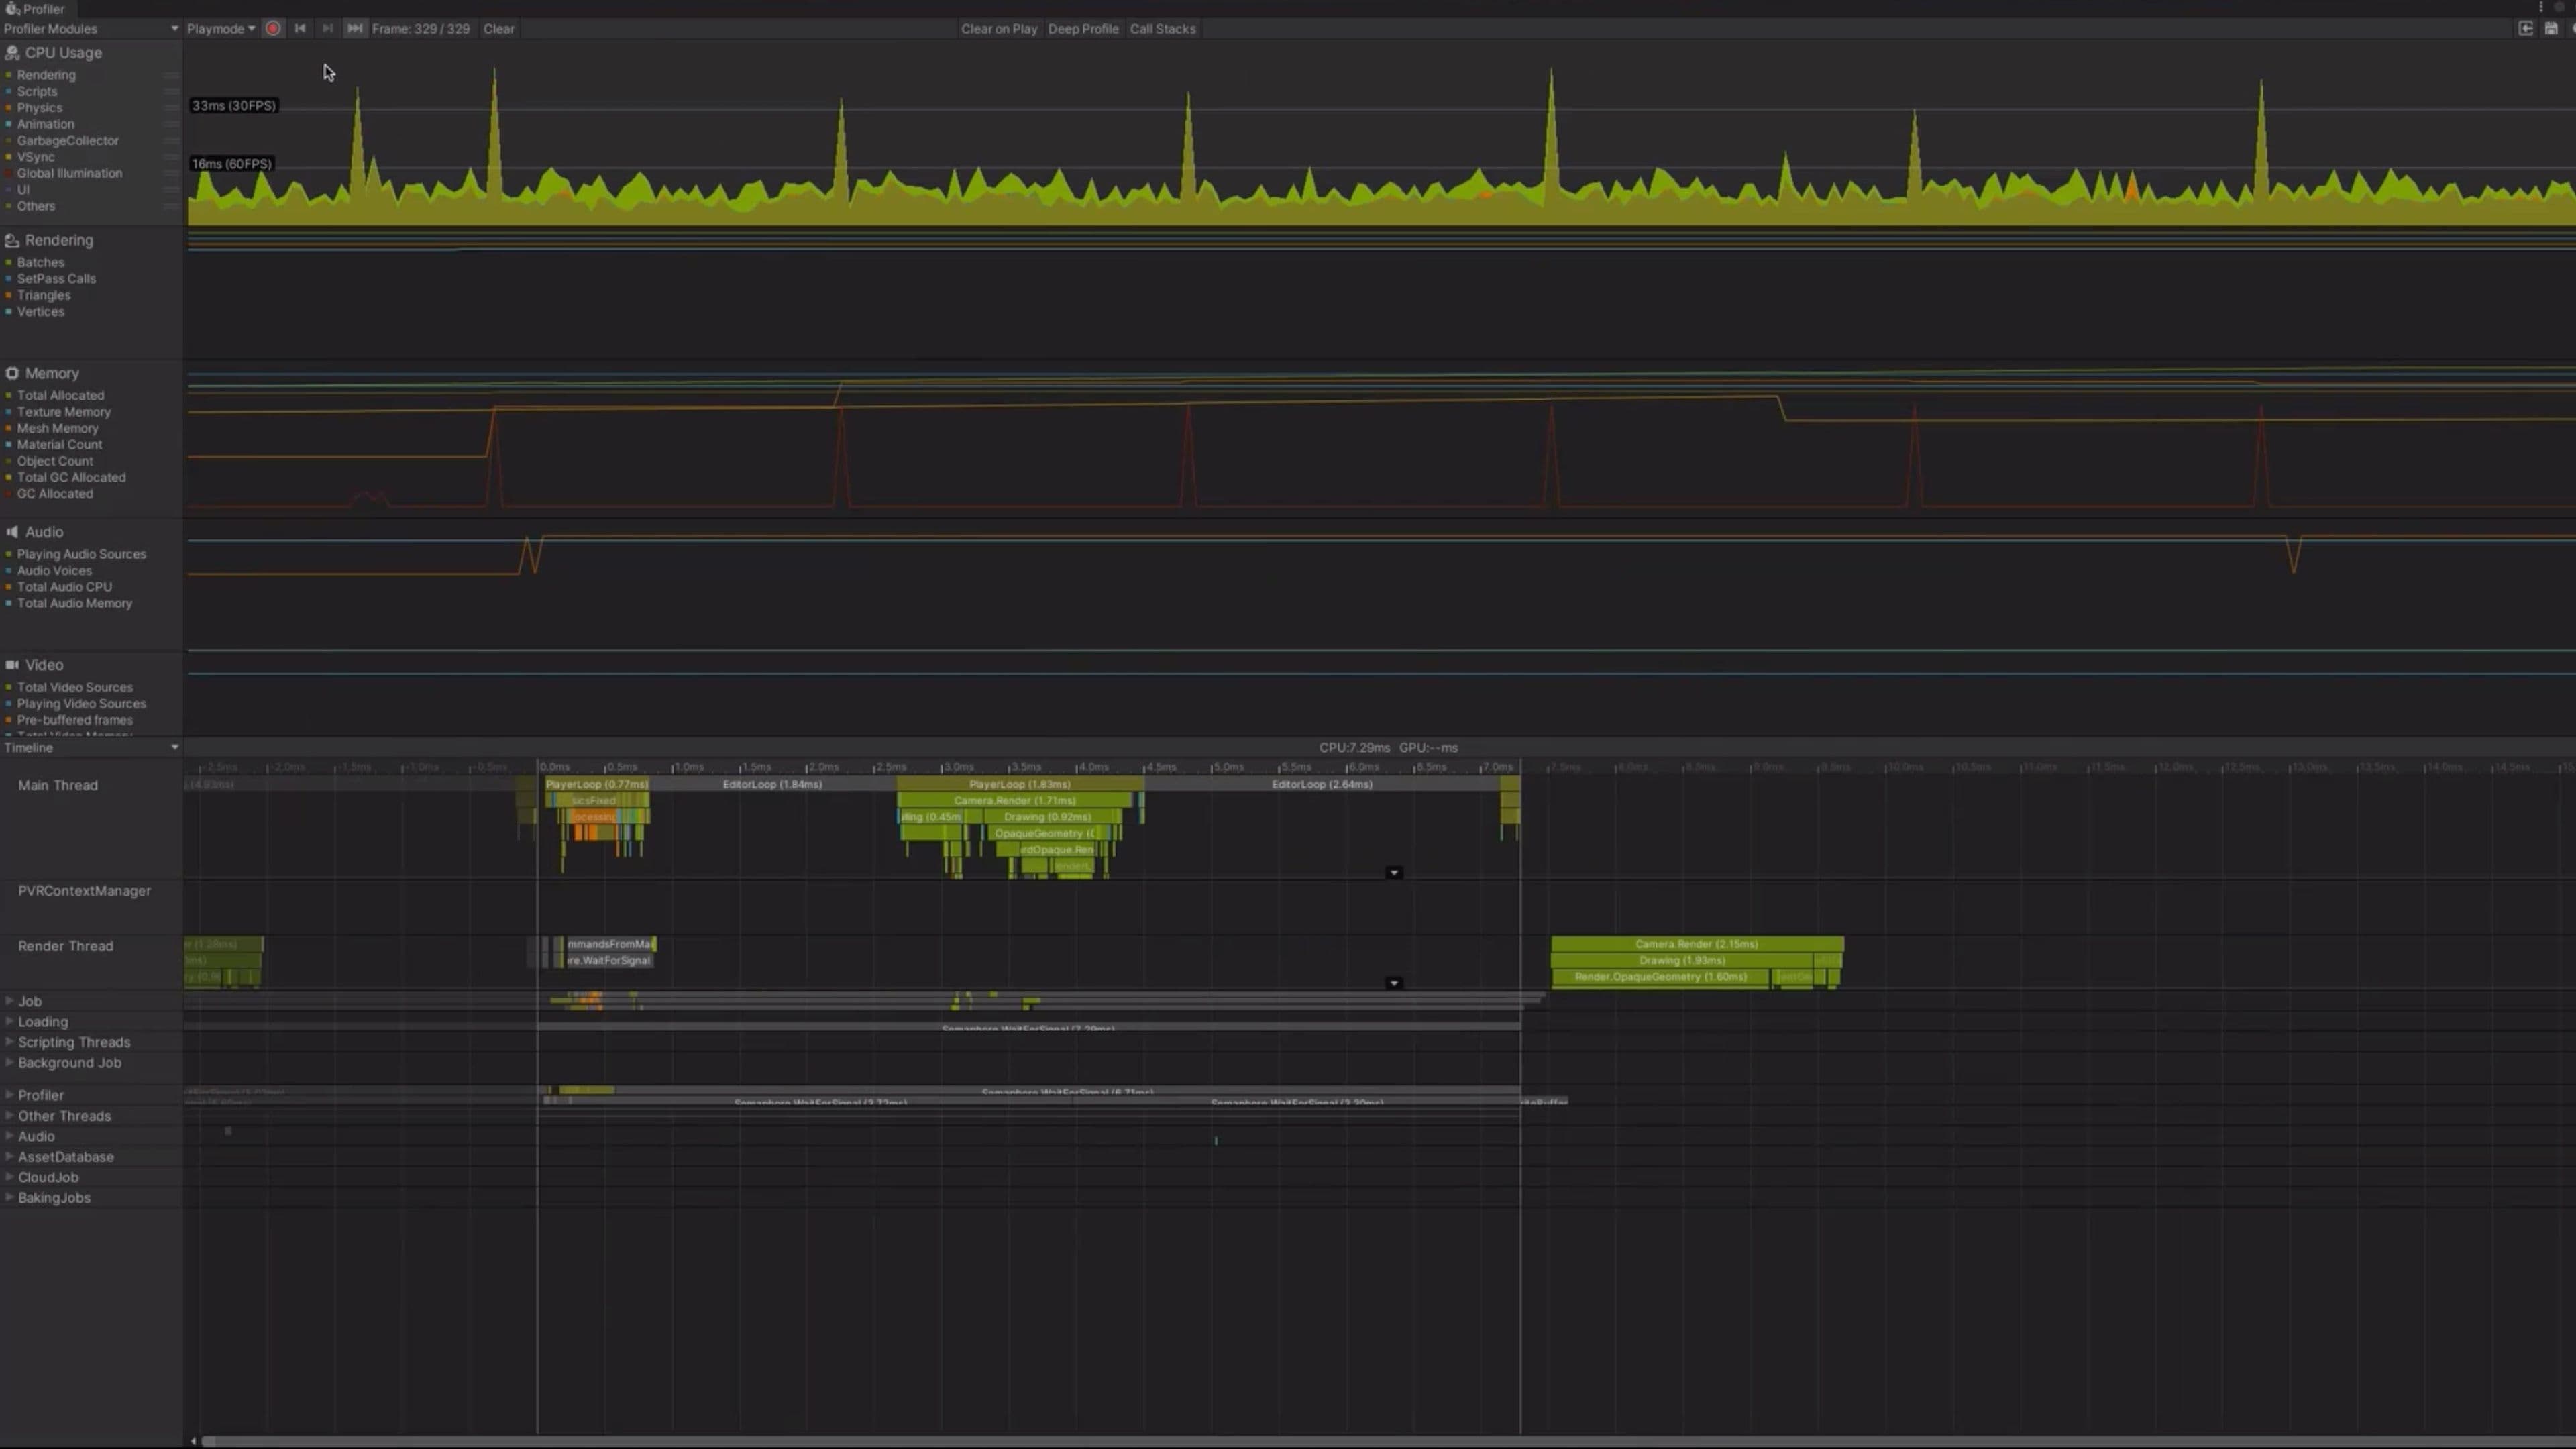
Among the several improvements to the profiling tools in Unity 2020.1, the Profiler connection to a Player is now more stable, particularly with low-end Android devices.
Metadata support for the C# Profiler API allows you to define what parameters can be exposed in the Profiler so you can get more context from your data and better understand what is affecting performance.
We have significantly cut down on capture memory overhead and capture times of the Memory Profiler Preview package.
As of 2020.1 you can access GPU profile data through the Recorder API. Use the Sampler API to collect the data and visualize it in your own runtime performance stats overlay.
The Profiler as a standalone app and flow event visualization
You now have the option to launch the Profiler as a standalone app. This will move the tool to a separate process outside of Unity, reducing the performance overhead when profiling the Editor and creating cleaner profile data.
See how Unity schedules jobs across threads via the Profiler's Flow Event feature. It allows you to detect when code in the main thread of execution is waiting for a job to complete in multithreaded code. This visualization adds event markers and flow lines, helping to expose the relationship between systems, jobs and threads. Not having to search for these dependencies manually saves you time.
Verified IDE packages now include Visual Studio
With this release, the Visual Studio integration is now a package, and we will not develop the built-in support further. The package also includes new features and improvements, like a faster startup of Visual Studio.
This follows on last year’s start to move integrated development environments (IDEs) and the Code Editor from core to packages, which began with Visual Studio Code and JetBrains Rider.
Furthermore, the JetBrains Rider IDE verified package received updates like Code Coverage support and user experience improvements, and the Visual Studio Code IDE verified package can now generate csproj files for IntelliSense incrementally and has autodiscovery of installations, among other updates.

New C# debugging workflow
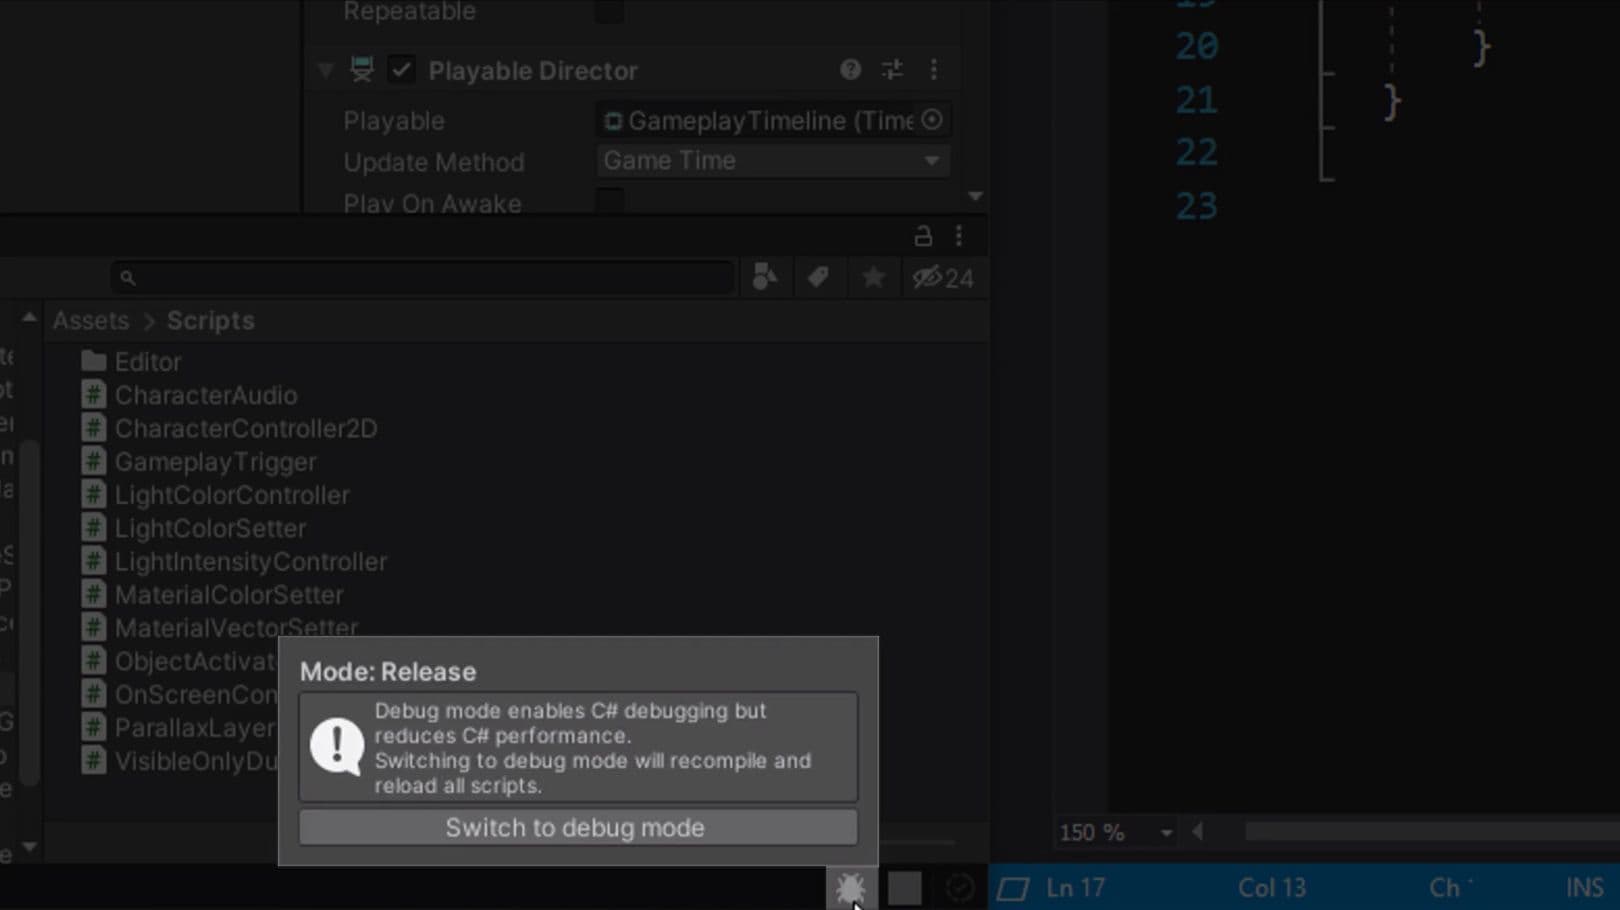
The new C# debugging workflow makes the Editor run with C# code optimization in Release Mode by default, improving performance when running your project in Play Mode.
To debug your project, you need to enable Debug Mode before entering Play Mode. You can switch between code optimization modes without restarting the Editor by selecting the Debug Button at the bottom right of the Unity Editor Status Bar.
Create fields for generic types directly
We improved support for serializing fields of generic types. In the past, if you had a generic type (such as class MyClass<T>), and you wanted to make a field using that type, you would have to define a non-generic subclass of it (like class MyClassInt : MyClass<int>). We’ve removed this limitation, so you no longer need to declare the generic subclass, and you can simply use the generic type directly.
Burst Compiler 1.3
We are evolving the Burst Compiler as a development tool, adding native debugging capabilities.
Using a native debugger attached to Unity, you can now set breakpoints, skip over and step into code. You can also inspect and navigate call stacks, variables, autos and threads.
Profile Analyzer improvements and Code Coverage (Preview)
The Profile Analyzer package enables users to compare frame and marker data from a set of Unity Profiler frames at the same time. New 2020.1 updates for this package improve overall performance and the experience of using the tool. This includes quality-of-life improvements for the user interface. Code Coverage helps you visualize which lines of your code are being tested.
